Energy Quotient User Documentation
The Energy Quotient platform delivers continuous waveform intelligence for mission-critical power systems. This documentation covers the platform architecture, sensor hardware, data access, edge analytics, and deployment options.
Platform
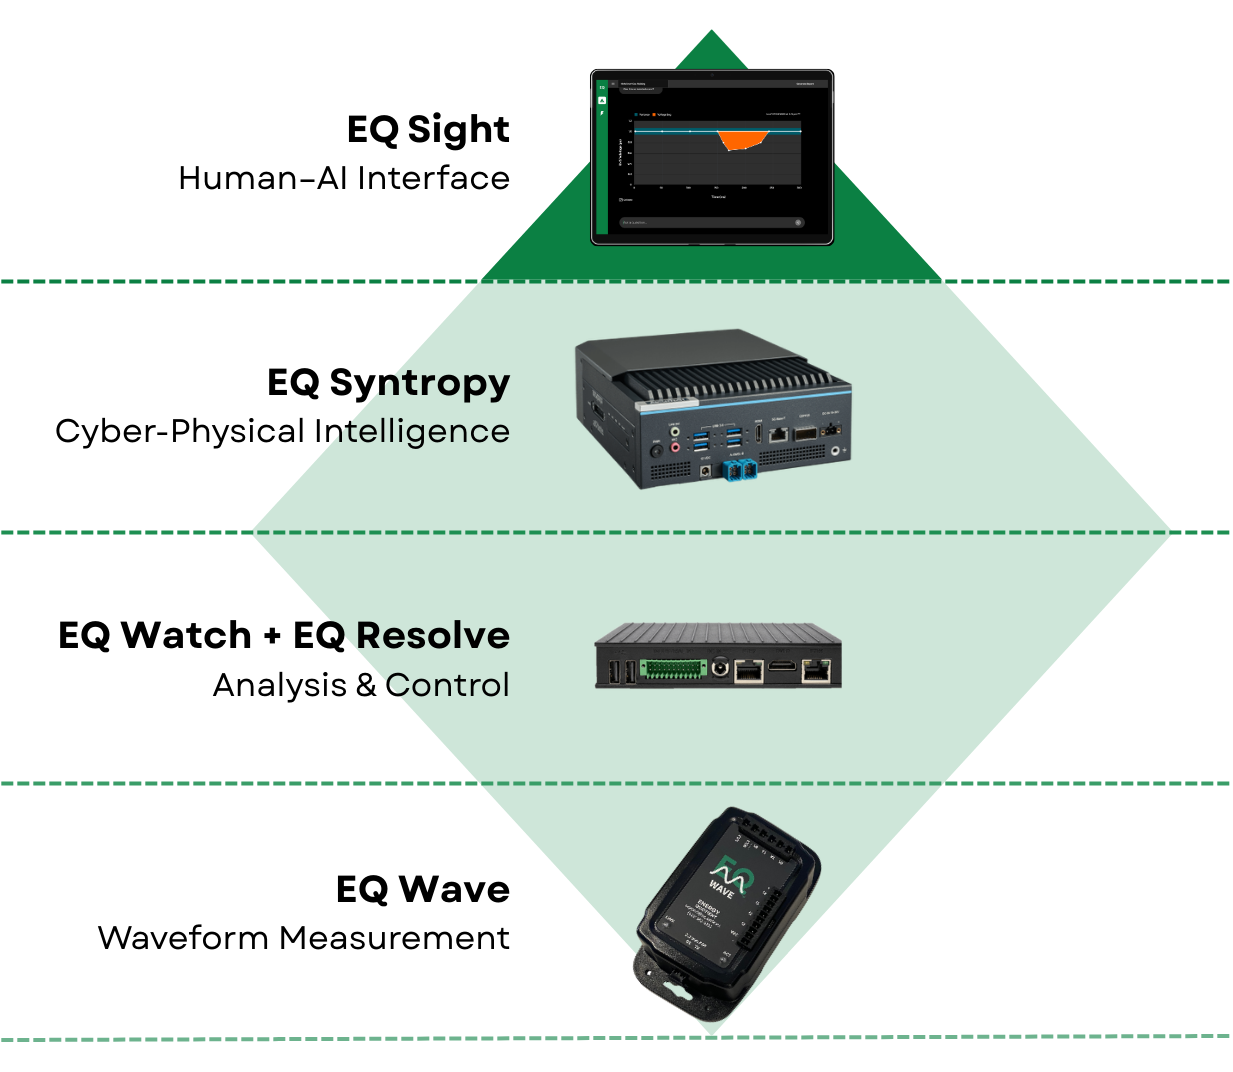
EQ Wave — High-fidelity continuous waveform capture
- 7-channel Continuous Point-on-Wave (CPOW) measurement (3-phase voltage + 4 current) at 32 kHz, 24-bit resolution
- Dual data streams: raw continuous waveforms + aggregated power monitoring
- Rugged, fanless design with two-stage measurement isolation and built-in backup power
EQ Watch — Data foundation
- High-bandwidth, low-latency ingestion pipeline (~6 Mbps per sensor, gap-free)
- Local Parquet storage with automatic rotation and optional data lake sync
- REST API and WebSocket streaming for concurrent consumers
EQ Syntropy — Edge analytics and agentic AI framework
- Physics-informed analysis with waveform-level evidence
- Statistical detectors, anomaly detection, and pattern interpretation
- API for historical queries and live streaming
EQ Sight — Human–AI interface for exploration and action
- Real-time dashboards with role-specific context
- Embedded AI assistant powered by EQ Syntropy
- Event detection, alerting, and diagnostic workflows
- JupyterLab for advanced analysis
EQ Resolve — Decision and control
EQ Wave is the only required component. For PMon-only access without EQ Watch, see the equser open-source Python toolkit. EQ Syntropy and EQ Resolve are optional.
Tools
equser — Open-source Python toolkit (GitHub · PyPI)
- Load and analyze CPOW and power monitoring (PMon) Parquet files with automatic scaling
- Gateway API client for historical queries and live WebSocket streams
- Plotting and analysis functions with bundled Jupyter notebooks
Getting Started
Service Status
Monitor EQ service availability at status.eq.systems. The status page covers core infrastructure, EQ Sight deployments, and documentation services, and auto-refreshes every 5 minutes.