Energy Quotient User Documentation
The Energy Quotient platform delivers continuous waveform intelligence for mission-critical power systems. This documentation covers the platform architecture, sensor hardware, data access, edge analytics, and deployment options.
Platform
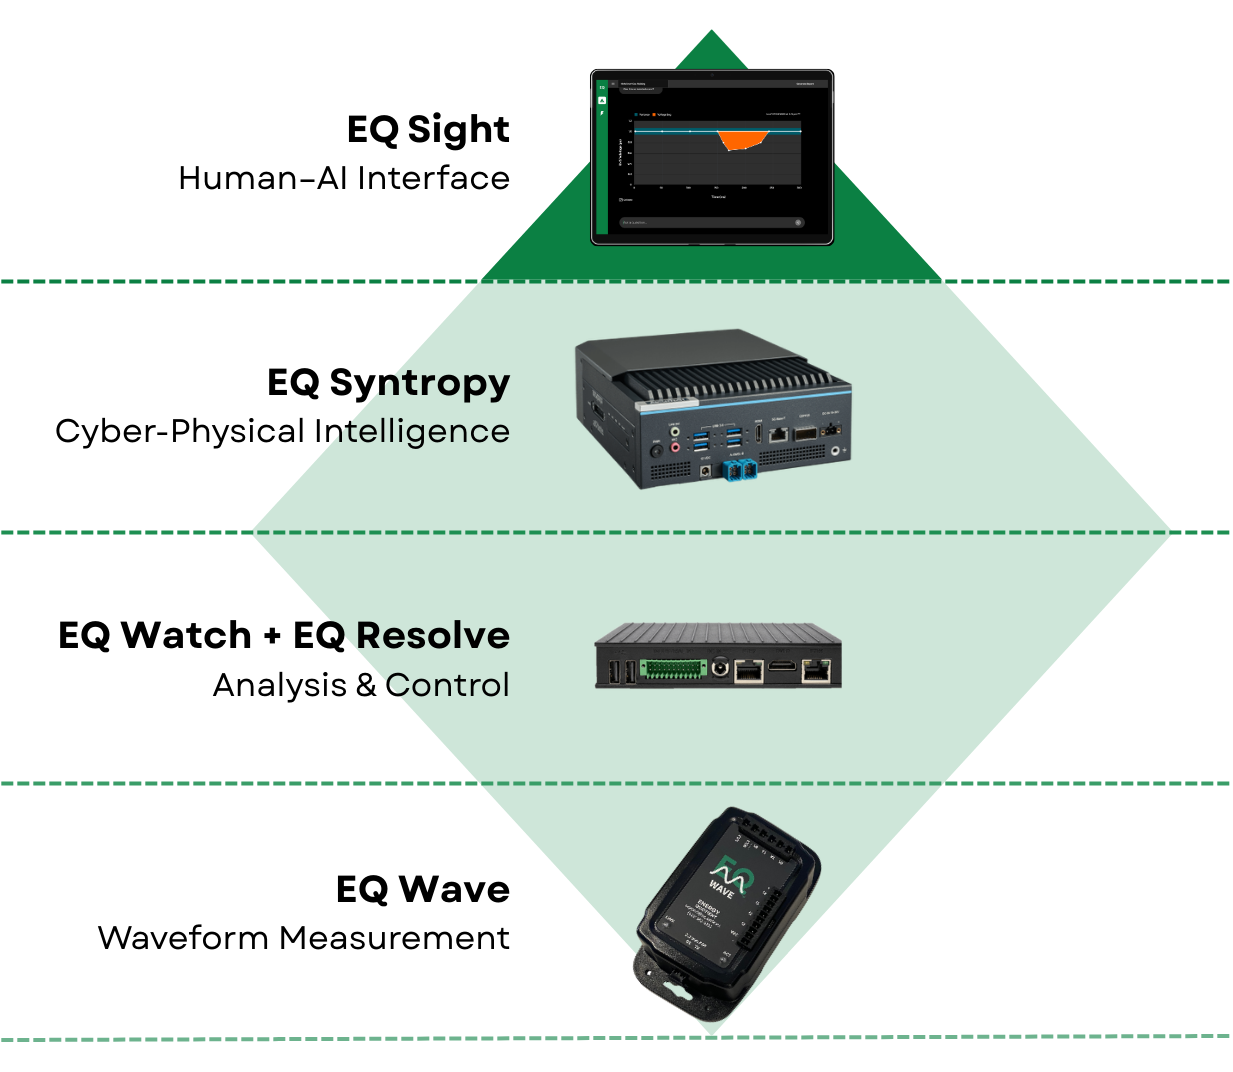
EQ Wave — High-fidelity continuous waveform capture
- 7-channel Continuous Point-on-Wave (CPOW) measurement (3-phase voltage + 4 current) at 32 kHz, 24-bit resolution
- Dual data streams: raw continuous waveforms + aggregated power monitoring
- Rugged, fanless design with two-stage measurement isolation and built-in backup power
EQ Watch — Data foundation
- High-bandwidth, low-latency ingestion pipeline (~6 Mbps per sensor, gap-free)
- Local Parquet storage with automatic rotation and optional data lake sync
- REST API and WebSocket streaming for concurrent consumers
EQ Syntropy — Edge analytics and agentic AI framework
- Physics-informed analysis with waveform-level evidence
- Statistical detectors, anomaly detection, and pattern interpretation
- API for historical queries and live streaming
EQ Sight — Human–AI interface for exploration and action
- Real-time dashboards with role-specific context
- Embedded AI assistant powered by EQ Syntropy
- Event detection, alerting, and diagnostic workflows
- JupyterLab for advanced analysis
EQ Resolve — Decision and control
EQ Wave is the only required component. For PMon-only access without EQ Watch, see the equser open-source Python toolkit. EQ Syntropy and EQ Resolve are optional.
Tools
equser — Open-source Python toolkit (GitHub · PyPI)
- Load and analyze CPOW and power monitoring (PMon) Parquet files with automatic scaling
- Gateway API client for historical queries and live WebSocket streams
- Plotting and analysis functions with bundled Jupyter notebooks
Getting Started
Service Status
Monitor EQ service availability at status.eq.systems. The status page covers core infrastructure, EQ Sight deployments, and documentation services, and auto-refreshes every 5 minutes.
EQ Wave
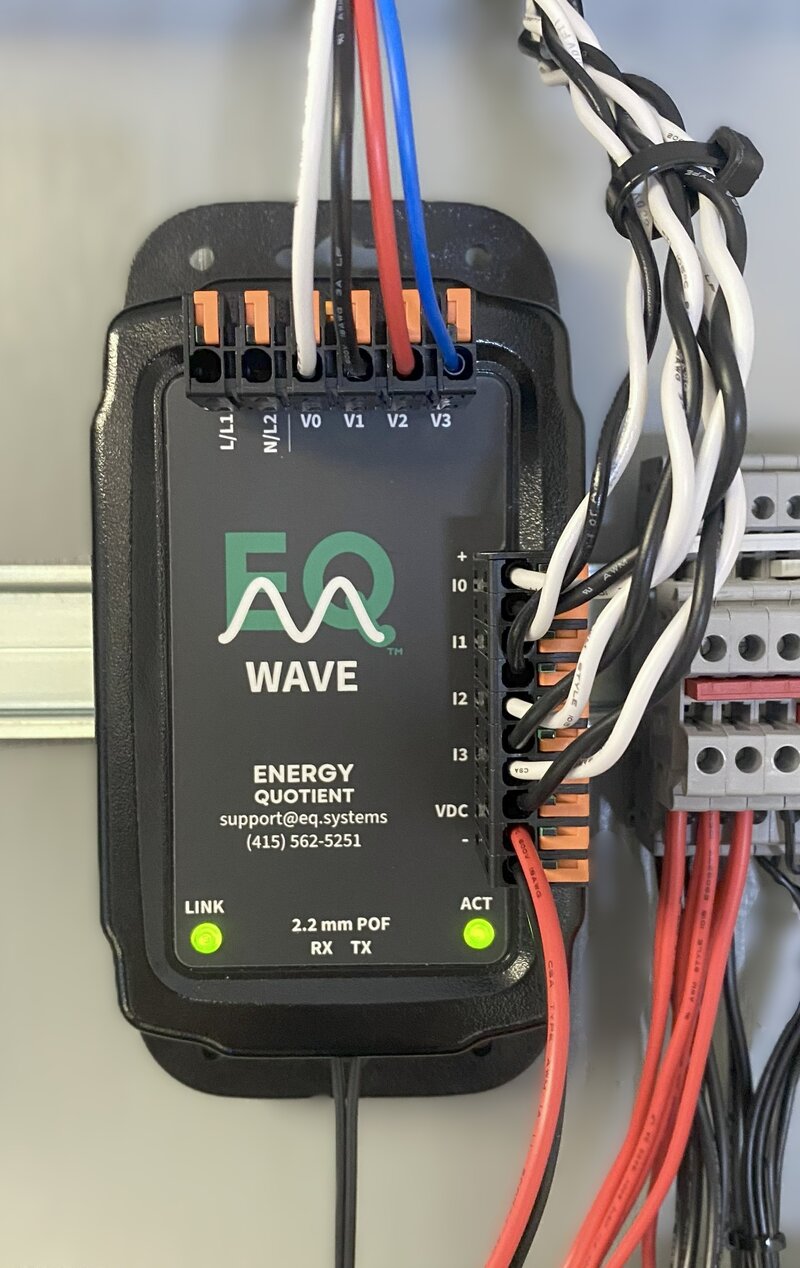
EQ Wave v1 installed with 3-phase voltage, current sensors, and POF fiber link
Purpose and Applications
The EQ Wave is a power system sensor that provides Continuous Point-on-Wave (CPOW) monitoring — uninterrupted, full-resolution waveform capture across all channels — alongside aggregated energy and power metrics (RMS, power, frequency, harmonics). Applications range from energy management and cost optimization through power quality investigation to controls and equipment protection.
- Two-stage measurement isolation with fiber optic networking and TCP data transport
- Fanless operation across -40°C to +70°C in a ruggedized enclosure
- Low-latency measurements: < 8 ms end-to-end with minimal timing variance
- Deterministic, gap-free streaming of waveform and metric data to EQ Watch, EQ Syntropy, and EQ Sight
Primary Use Cases
Power Quality Analysis:
- CPOW capture for complete event investigation
- IEC 61000–4-30 Class S measurements for standards-based reporting
- High-resolution visibility into sags, swells, transients, and distortion
- Harmonic analysis and distortion characterization
Energy Management:
- Continuous energy monitoring and demand profiling
- Load analytics for optimization and forecasting
- Power factor monitoring and correction verification
- Cost allocation and billing verification
Equipment Protection & Diagnostics:
- Signal-level monitoring of voltage and current waveforms
- Threshold-based alerting for out-of-range conditions
- Historical trending for predictive maintenance
- Integration with facility monitoring systems
- Inputs suitable for closed-loop monitoring and future control applications
How It Works
The EQ Wave continuously samples all voltage and current channels at 32 kHz (v1; higher for v2), providing continuous waveform monitoring without gaps or blind spots. CPOW data is streamed and stored as uninterrupted, lossless waveform samples without resampling, trigger dependence, or summarization. Data is streamed over TCP/IP in two formats:
- CPOW: Raw sample data streamed in 2 ms frames for detailed signal-level analysis
- Power monitoring (PMon): Aggregated metrics reported every 10 cycles (50 Hz grids) or 12 cycles (60 Hz grids), providing a consistent 5 Hz update rate for real-time dashboards and trending
The gateway runs EQ Watch, which is storage-agnostic, supporting microSD via USB adapter, NVMe SSD, external SSD, or network-attached storage. With drives up to multiple terabytes, deployments can retain months or even years of continuous waveform history. EQ Syntropy adds physics-informed AI analytics and diagnostics. EQ Sight provides real-time visualization, event monitoring, and interactive investigation.
Application Areas
- Semiconductor Fabrication: Power quality monitoring for process control
- Medical Imaging: Equipment power validation and monitoring
- Data Centers: Power management and monitoring
- Industrial Processes: Real-time monitoring and control
- Grid Infrastructure: Distributed resource monitoring
- Energy Systems: Energy management and optimization
Key Features
Data Acquisition
- 32 kHz sampling (v1) with 24-bit ADC resolution (~16.5-bit effective number of bits (ENOB)); v2 offers rates up to 64 kHz
- Complete 3-phase monitoring: 3 voltage + 4 current channels
- Sub-cycle response time
- Global Navigation Satellite System (GNSS)/GPS time synchronization via optional onboard receiver (v1: hardware footprint present, firmware support planned; v2: full support)
Design Specifications
- Two-stage measurement isolation through fiber optics and capacitive-coupled digital communication
- Industrial temperature range: -40°C to +70°C, fanless operation
- Robust enclosure: Polycarbonate (v1) or aluminum (v2)
- Universal power input: 85–528V AC or 5–36V DC (v1.2+); USB cable included for benchtop testing via DC input
- Internal power backup (v1.2 and later)
- Compact industrial form: 140 × 89 × 41 mm
Real-time Processing
- Dual network services:
- CPOW reported in 2 ms frames (TCP port 1534)
- PMon reported every 10/12 cycle (TCP port 1535)
- Gap-less signal-level streaming with onboard data storage
- Low-latency data delivery: < 8 ms (½ cycle) end-to-end
- Minimal timing variance for reliable measurements
Platform Integration
EQ Wave sensors stream data to an EQ Gateway running:
- EQ Watch: Data collection, storage, REST API, WebSocket streaming, and facility integration (Modbus TCP, MQTT, DNP3 available upon request)
- EQ Sight: Real-time visualization, event monitoring, alerting, and reporting
- EQ Syntropy (optional): Physics-informed AI analytics and diagnostics
The v2 series adds FPGA-based signal processing, configurable sampling up to 64 kHz, dual network interfaces (POF + RJ45), onboard storage, and an aluminum enclosure. See v2 Overview for architecture details and current status.
EQ Wave Quick Start
What You Need
- EQ Wave unit
- Power source (5–36V DC for v1.2+ or 85–528V AC)
- Network connection
- Pre-configured EQ Gateway or other system running EQ Watch software
Steps
1. Physical Installation
Mount the Device:
- Install on DIN rail or mount to panel
Connect Power:
- For DC power: Connect to VDC +/- terminals (5–36V DC for v1.2+)
- For AC power: Connect to L/L1 and L2/N terminals (85–528V AC line-to-neutral or line-to-line)
Connect Network:
- Connect POF (plastic optical fiber) cable between sensor and media converter. Each end has one transmit (red light visible) and one receive port; connect transmit to receive on each side.
- Connect media converter to gateway via RJ45 Ethernet
- Power the media converter via USB from the gateway or a separate USB power adapter
2. Network Configuration
The gateway software will communicate with EQ Wave using the following network settings by default:
- IP address: 192.168.10.10 (fixed)
- Subnet: 255.255.255.0
Future firmware updates will support automatic network configuration.
3. Verify Operation
Check LEDs on EQ Wave:
- On startup, both LEDs flash red briefly; ACT then turns solid green when active
- When the fiber link to the gateway is established, both LEDs go off momentarily. Then LINK turns solid green to indicate connection, and ACT blinks and turns green when data transfer is active.
Confirm in EQ Sight:
Open a web browser and navigate to the gateway’s LAN address or your pre-assigned subdomain (e.g., [site].pq.app). The sensor should appear as a connected device.
Next Steps
See Installation Guide for voltage and current sensor wiring, safety precautions, mounting specifications, and cable routing.
See Configuration Guide for network settings, power system parameters, and advanced features.
See Data Access Guide for protocol specifications, sample code, and API documentation.
Troubleshooting
- Both LEDs off — Verify power at the input terminals. Check polarity for DC inputs.
- LINK LED off — Verify the POF cable is fully seated at both the sensor and media converter. Check that the media converter has power.
- Sensor not in EQ Sight — Confirm the gateway’s sensor-facing interface is on the same subnet (192.168.10.x).
See the Troubleshooting Guide for further diagnostics.
EQ Wave Installation
Safety Requirements
Installation of the EQ Wave sensor involves direct connection to energized electrical systems and must be performed only by qualified electrical personnel familiar with electrical safety procedures, local electrical codes, and proper lockout/tagout protocols.
Critical Safety Information
Qualified Personnel:
- Electrical contractor license (where required by local jurisdiction)
- Experience with 3-phase power systems up to 600V
- Knowledge of power measurement equipment
- Understanding of NFPA 70E arc flash and electrical safety standards
De-Energization Requirements:
- De-energize all circuits using proper lockout/tagout (LOTO) procedures before making electrical connections
- Follow NFPA 70E or equivalent electrical safety standards
- Use appropriate personal protective equipment (PPE):
- Arc-rated clothing (minimum 8 cal/cm² where required)
- Arc-rated face shield (if working on energized circuits)
- Insulated gloves rated for working voltage
- Safety glasses and hard hat (where required)
Default configuration: Voltage-output current transducers with internal burden resistors (e.g., Socomec Accu-CT, 333mV output).
Do NOT use traditional current transformers (CTs) with default configuration. CTs produce dangerous open-circuit voltages without proper external burden resistors.
Before installation:
- Verify your current sensors are voltage-output transducers (333mV output) OR
- Contact support@eq.systems to configure unit for traditional CTs with external burden resistors
- See detailed current sensor requirements in Step 3 below
Voltage and Power Limits:
- Voltage measurement inputs (V0-V3): 600V RMS maximum, Category II
- AC power supply terminals (L/L1, N/L2): 528V AC maximum
- For systems above 600V line-to-ground, use appropriate potential transformers (PTs)
- For AC power above 528V, use external DC power supply
Installation Environment:
- Operating temperature: -40°C to +70°C
- Install in electrical enclosure or panel providing appropriate environmental protection
- Maintain clearances per local electrical code requirements
Package Contents
EQ Wave Device Unit:
- Device with serial number EQW-_________ (record for support reference)
-
Mounting hardware (one option, as specified when ordering):
- 3M Dual Lock adhesive strips (standard)
- DIN rail clips (35mm rail, IEC 60715)
- Magnets for ferrous surfaces
- USB power cable (for benchtop testing and configuration)
Communications:
- 2.2mm duplex POF (plastic optical fiber) cable (default 2m length; custom lengths available)
- Media converter (Firecomms FY-ENC-KSU)
- Media converter USB power cable
- Media converter USB power supply (5V, 0.5A)
- POF cutting tool
- Cat5e Ethernet patch cable (RJ45, for media converter to gateway connection)
Installation Materials:
- Self-adhesive cable identification labels
- Alcohol prep pad (surface preparation for adhesive mounting)
Accessories: Additional POF cable and media converter kits (FF-FYENT-KSU, includes media converter, USB power cable, USB power supply, POF cutting tool, and Cat5e patch cable) are available from FiberFin in North America.
Note: The EQ Wave requires a host computer for data collection and configuration. This can be the EQ Gateway (sold as a separate option) or a customer-supplied computer. See Deployment Options for details.
Connection Guide
Step 1: Mount the Device
Mounting Method (as supplied with your kit):
3M Dual Lock Adhesive (standard):
- Clean mounting surface with alcohol prep pad; allow 15 seconds to dry
- Peel protective backing from adhesive strips (pre-applied to sensor enclosure)
- Position sensor and press firmly for 30 seconds
DIN Rail Clips:
- Hook bottom edge of clip onto DIN rail (35mm per IEC 60715)
- Lift the device upwards to compress the springs while bringing the top edge of the clip over the top of the rail
- Release the device, then check that it is secure by pulling downwards and tilting side to side slightly
Magnetic Mounting:
- Ensure ferrous mounting surface is clean and flat
- Position sensor; magnets hold securely on contact
- Verify mounting by attempting to slide sensor (should resist movement)
Clearance Requirements:
- Minimum 25mm clearance on all sides for convective cooling
- Do not obstruct optical fiber connector or terminal access
- Mounting surface temperature must remain within -40°C to +70°C range
Step 2: Connect Voltage Measurement Inputs
Ensure circuits are de-energized and locked out per NFPA 70E before making any electrical connections.
Voltage Input Terminals (Weidmüller Omnimate 4.0 push-in plug, 7.5 mm pitch, 12–20 AWG; header 8000078318, plug 8000078357):
| Terminal | Function | Typical Connection | Typical Wire Color (NA/EU) |
|---|---|---|---|
| V0 | Neutral/Reference | System neutral or ground reference | White / Blue |
| V1 | Phase A (L1) | Line 1 voltage | Black / Brown |
| V2 | Phase B (L2) | Line 2 voltage | Red / Orange |
| V3 | Phase C (L3) | Line 3 voltage | Blue / Gray |
Voltage Measurement Specifications:
- Maximum input voltage: 600V RMS line-to-ground (Category II)
- Input impedance: 4 MΩ per channel (V1/V2/V3 referenced to V0)
- For systems above 600V: Use potential transformers (PTs) and connect sensor to PT secondaries
- Reference input V0: Connect to system neutral or ground reference for proper common-mode rejection
Connection Procedure:
- Strip wire ends 7–8 mm
- Push stripped wire into the connector until it clicks (no tools required, even for stranded wire without ferrules)
- Confirm the green visual indicator has popped out on each terminal
- To release a wire, lift the lever to open the contact
- Apply terminal identification labels to facilitate future maintenance
Wire Routing:
- Route voltage wiring separately from current sensor wiring where practical
Step 3: Connect Current Measurement Inputs
Current Input Terminals (Weidmüller Omnimate 4.0 push-in plug, 5.0 mm pitch, 14–20 AWG; header 8000072456, plug 2741750000):
| Terminals | Function | Typical Connection | Polarity | Standard Device Type |
|---|---|---|---|---|
| I0+/I0- | Neutral/residual | Neutral or ground current (optional) | White→(+), Black→(-) | Voltage-output transducer |
| I1+/I1- | Phase A current | Phase A current sensor | White→(+), Black→(-) | Voltage-output transducer |
| I2+/I2- | Phase B current | Phase B current sensor | White→(+), Black→(-) | Voltage-output transducer |
| I3+/I3- | Phase C current | Phase C current sensor | White→(+), Black→(-) | Voltage-output transducer |
Default configuration: Voltage-output current transducers with internal burden resistors (e.g., Socomec Accu-CT, rated output 333mV at full scale).
Do NOT use current transformers with the default configuration. Traditional current transformers require external burden resistors and will produce dangerous open-circuit voltages if connected incorrectly.
Rogowski coils:
- Rogowski coils with internal integrators and 333mV voltage output are compatible with the standard configuration
- When AC powered, the device’s 12V DC output (VDC+/VDC-) can power these integrated Rogowski coil signal conditioners
- Raw Rogowski coils (without integrator) require special internal configuration and must be specified when ordering
If using traditional current transformers or raw Rogowski coils (without integrator), this must be specified when ordering to ensure proper internal configuration.
Current Sensor Installation:
- Install current sensors on conductors with arrow or directional marking pointing toward the source (or as indicated)
- Verify current sensor ratio matches the expected load current (e.g., 100A sensor for 80A maximum load)
- Secure current sensor to conductor per manufacturer specifications
- Route current sensor cables separately from high-voltage wiring
- Push sensor wires into connectors until they click (observing polarity)
- Confirm the green visual indicator has popped out on each terminal
Polarity:
- Correct polarity is critical for accurate power measurement; reversed polarity will show negative power for consuming loads
- If polarity is reversed, physically swap the connections at the terminal
Wire Colors:
- Shown are typical for Socomec Accu-CT and similar transducers
- Always verify wiring per your specific current sensor manufacturer’s documentation
Step 4: Apply Power
Power Input Terminals (same connector as voltage inputs, 7.5 mm pitch push-in, 12–20 AWG):
AC Power Option (85–528V AC, 50/60 Hz):
| Terminal | Function | Typical Voltage Range | Notes |
|---|---|---|---|
| L/L1 | AC line input | 85–528V AC | Phase or neutral depending on system |
| N/L2 | AC neutral/second line | 85–528V AC | Neutral or second phase |
- Reference-agnostic design supports line-to-neutral or line-to-line configurations
- Common voltages: 100V (Japan), 120V (North America), 230V (Europe), 277V (commercial L-N), 480V (industrial L-L)
- Maximum input: 528V AC
- For systems above 528V AC: Use external DC power supply
- Power consumption: 3.3W typical
DC Output (when AC powered, same connector as current inputs, 5.0 mm pitch push-in):
- Terminals VDC+/VDC- provide regulated DC output for auxiliary devices
- Default output: 12V DC at up to 1W (custom voltages available when specified at ordering)
- Typical use: Powering Rogowski coil signal conditioners, transmitters, or indicator lights
DC Power Option (5–36V DC, v1.2 only, same connector as current inputs, 5.0 mm pitch push-in):
The 5–36V DC input range applies to v1.2 hardware only. Earlier versions (v1.0, v1.1) have different DC voltage outputs and may be damaged by certain DC input voltages. Contact support@eq.systems for specifications if using v1.0 or v1.1.
| Terminal | Function | Voltage Range | Polarity | Notes |
|---|---|---|---|---|
| VDC+ | Positive DC input | 5–36V DC (v1.2) | (+) | Red wire typical |
| VDC- | Negative DC input | Ground reference | (-) | Black wire typical, recommend earth ground connection |
- Wide input range (5–36V) accommodates automotive (12V) and industrial (24V) DC sources
- Reverse polarity protected
- Power consumption: 2.4W typical
- Recommended: Connect VDC- to earth ground for optimal signal quality and noise immunity
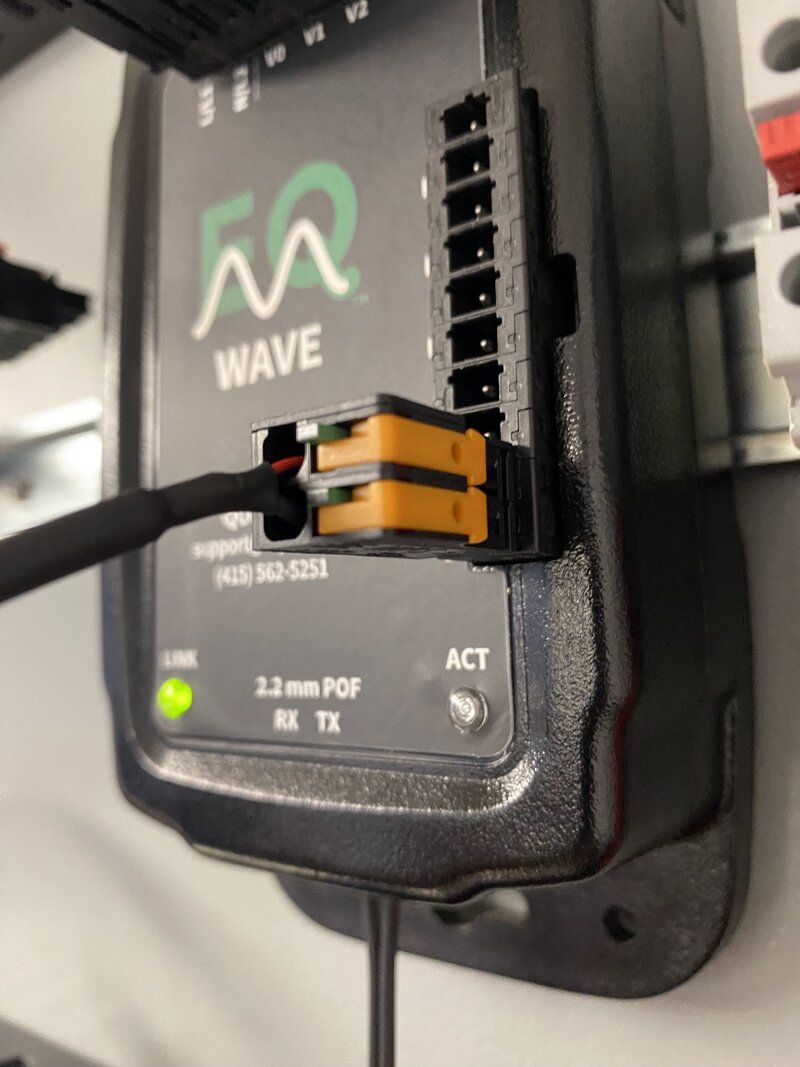
USB power cable connected to DC input for benchtop testing
The included USB power cable provides a convenient 5V DC source for benchtop testing and configuration without requiring AC mains or an external DC supply. The USB cable connects to the VDC+/VDC- terminals.
Grounding and Bonding
Chassis Ground:
- Connect sensor enclosure to facility earth ground per local electrical code
- Recommended wire: 12 AWG minimum copper conductor
- Verify continuity to main ground bus with multimeter
- Proper grounding ensures optimal signal quality and noise immunity
Signal Grounds:
- All measurement circuits are isolated from chassis
- VDC- terminal should be connected to earth ground when using DC power
- Avoid ground loops through current sensor shields
LED Status Indicators:
After applying power, observe the two LED indicators on the device enclosure:
- Startup: Both LINK and ACT LEDs flash red briefly, then both turn solid green
- Connected: When the fiber link is established, both LEDs go off momentarily. Then LINK turns solid green to indicate connection, and ACT blinks and turns green when data transfer is active.
- Fault condition: LEDs remain red — see Troubleshooting section
Step 5: Connect Plastic Optical Fiber (POF)
POF Cable Preparation (if not supplied with pre-installed connectors):
- Cut cable end: Use the supplied POF cutting tool to make a clean, perpendicular cut
- Separate duplex fibers: Split the webbing 10–15mm from the cut end to separate the two fiber strands
- Verify clean ends: Inspect fiber ends; cuts must be smooth and perpendicular, free from debris
Connect to EQ Wave Device:
- Unlock OptoLock® connector (Firecomms): Pull retainer clip outward to open position
- Insert fiber strands: Push both prepared fiber ends fully into the OptoLock receptacle until seated
- Lock connector: Press retainer clip back to closed position to secure fibers
- Verify insertion: Fibers should be firmly held and not pull out with gentle tugging
Route POF Cable:
- Route cable from sensor location (inside electrical panel) to media converter location (typically outside panel), up to 100 m
- Minimum bend radius: 25mm (do not create sharp bends or kinks)
- Avoid routing near sharp edges that could damage fiber
- Secure cable with tie-wraps or cable clamps every 300–500mm along routing path
Connect to Media Converter:
- Repeat OptoLock connection procedure at media converter end
- Match transmit/receive fibers (if devices are powered, illuminated fiber connects to dark port, dark fiber to illuminated port)
Power Media Converter:
- Recommended (simpler): Connect media converter USB power cable to EQ Gateway USB port
- Alternative: Connect to included USB power supply and plug into mains power
Verify Optical Link:
After connecting fiber and powering media converter:
- EQ Wave sensor: LINK LED turns solid green, ACT LED turns green when data transfer is active
- Media converter: Both amber and green LEDs illuminated
- If link does not establish, see Troubleshooting section
Close Electrical Panel:
Once LED status confirms successful link establishment, reinstall panel cover and secure per local electrical code requirements.
Data Access and Configuration
With EQ Watch (Recommended)
EQ Watch records all data locally and provides REST API and WebSocket access. EQ Sight provides real-time visualization of waveforms, power metrics, and harmonics. Data can be exported using the equser Python package. Additional protocol support for SCADA/BMS integration is available upon request.
Setup: Refer to the Gateway Overview for setup procedures.
Direct Network Access (Advanced Integration)
For custom applications requiring direct sensor communication:
Network Configuration:
- IP address: 192.168.10.10 (fixed)
- Subnet: 255.255.255.0
- Connect to sensor network via media converter and Ethernet
Data Protocols:
- CPOW: TCP port 1534 — real-time high-resolution waveform streaming
- PMon: TCP port 1535 — 10 or 12 cycle aggregated measurements
Documentation:
- API specifications and programming examples available from support@eq.systems
- See Data Access Guide for protocol details and sample code
Verification Checklist
After completing installation, verify system operation through EQ Sight or direct network access.
Physical Installation Verification
- Device securely mounted with adequate clearance (25mm minimum all sides)
- All voltage and current measurement wires fully seated in push-in connectors
- Power connection secure (AC or DC, not both)
- POF cable connected at both ends (sensor and media converter)
- POF cable routing has no sharp bends (25mm minimum radius)
- Terminal identification labels applied for future reference
- Electrical panel cover reinstalled and secured
LED Status Verification
- LINK LED solid green (optical link established)
- ACT LED solid green (sensor active and transmitting data)
- Media converter LEDs illuminated (both amber and green)
Voltage Measurement Verification
- All phase voltages displayed and within ±5% of nominal system voltage
- Phase-to-phase voltages balanced (within 2% of each other for symmetrical systems)
- Phase sequence correct (A→B→C rotation, 120° phase separation for 3-phase systems)
- Voltage reference (V0) reading appropriate for system configuration
Current Measurement Verification
- All phase currents displaying reasonable magnitudes for connected load
- Current magnitudes balanced (within expected range for load configuration)
- Active power (kW) positive for all phases (consuming load) or as expected for generation
- Power factor values reasonable for load type
- Current sensor polarity correct on all phases (reverse polarity if power shows negative for consuming loads)
Network Communication Verification
- Gateway can communicate with sensor (web interface shows live data)
- Data updating in real-time (waveforms refreshing, values changing with load)
- No communication errors or timeout messages
- Network link stable over 5–10 minute observation period
Troubleshooting
For comprehensive troubleshooting beyond installation issues, see the Troubleshooting Guide.
Common Installation Issues
Both LEDs Off - No Power
Symptoms: LEDs completely dark, no startup flash.
Diagnostic Steps:
- Verify power source is energized (measure voltage at source)
- Check terminal connections for proper seating (pull gently to confirm)
- Verify correct power type (AC or DC, not both)
- For AC power: Verify voltage within 85–528V range
- For DC power: Verify voltage within 5–36V range and correct polarity
Solutions:
- Verify power supply voltage and re-check terminal connections
- Ensure power source circuit breaker is closed
- For DC power: Verify polarity (VDC+ positive, VDC- negative)
- If power verified at terminals but sensor not operating, contact support@eq.systems
LEDs Remain Red - Fault Condition
Symptoms: LEDs flash or remain solid red after startup, do not turn green.
Diagnostic Steps:
- Check all measurement input connections for proper seating
- Verify no short circuits or over-voltage conditions on measurement inputs
- Cycle power (disconnect, wait 10 seconds, reconnect)
- Check for visible damage to sensor enclosure or terminals
Solutions:
- Verify all terminal connections are fully seated
- Disconnect measurement inputs temporarily to isolate fault
- If fault persists with no connections, contact support@eq.systems for RMA
LEDs Not Green - No Optical Link
Symptoms: ACT LED solid green, but LINK LED not solid green.
Diagnostic Steps:
- Verify media converter has power (LEDs illuminated)
- Check POF cable connections at both ends (sensor and media converter)
- Inspect fiber ends for contamination or damage
- Verify cable routing has no sharp bends or pinch points
Solutions:
- Remove and reconnect POF cable at both ends, ensure full insertion
- Clean fiber ends with isopropyl alcohol if contaminated
- Re-cut fiber ends if damaged or poorly prepared
- Try swapping transmit/receive fibers at media converter
- If link cannot be established, refer to EQ Gateway troubleshooting documentation or contact support@eq.systems
Negative Power Readings - Current Sensor Polarity Reversed
Symptoms: Active power (kW) shows negative for consuming loads on one or more phases.
Solutions:
- Recommended: Correct polarity via EQ Gateway software configuration (no rewiring required)
- Alternative: Physically reverse current sensor connections for affected phase (swap + and - terminals)
Incorrect Phase Sequence
Symptoms: Phase rotation displays as A→C→B instead of A→B→C, or phases are misidentified.
Solutions:
- Recommended: Correct phase mapping via EQ Gateway software configuration
- Alternative: Verify and correct voltage input wiring to match actual system phases
Technical Specifications
For complete technical specifications, see v1 Specifications.
EQ Wave Configuration
This guide covers the configuration parameters for EQ Wave v1 sensors. Refer to the Installation Guide for hardware setup.
Network Settings
EQ Wave v1 ships with fixed network settings:
- IP Address: 192.168.10.10
- Subnet Mask: 255.255.255.0
- TCP Services: Port 1534 (CPOW waveform data), Port 1535 (PMon power metrics)
These settings are factory-configured and cannot be changed in the field with current firmware. The gateway’s sensor-facing interface must be configured on the same subnet (default: 192.168.10.2).
Future firmware updates will support automatic network configuration.
Power System Parameters
The following parameters are set at the factory based on your order specifications. Contact support@eq.systems to request changes.
System Type
- Number of phases: 1, 2, or 3
- Nominal frequency: 50 Hz or 60 Hz
- Nominal voltage: Typically 120V, 208V, 240V, 277V, or 480V
Current Sensor Setup
- Default configuration: Voltage-output current transducers (333 mV at full scale, e.g., Socomec Accu-CT)
- Alternative sensors (must be specified when ordering): Split-core CTs (5A secondary typical), Rogowski coils (100 mV/A output typical)
- CT ratio (e.g., 150:5 for 150A primary, 5A secondary)
- CT direction (ensure power flow polarity is correct)
Polarity Convention:
- CT Arrow: Points toward load
- Primary Current: Flows from source to load
- Secondary Connection: I+ connects to CT terminal marked with arrow
- Power Factor: Positive for inductive loads when properly connected
Voltage Scaling
Voltage Division Factor: 1335.833333
System Compatibility:
| System Type | Recommended PGA Setting | Overvoltage Margin |
|---|---|---|
| 600V Delta (L-L) | 1 | 57.4% |
| 480V Delta (L-L) | 1 | 96.8% |
| 600/346V Wye (L-N) | 2 | 36.3% |
| 480/277V Wye (L-N) | 2 | 70.4% |
| 240V Single-phase | 2 | 96.8% |
| 240/120V Split-phase | 4 | 96.8% |
Measurement Specifications
- Input Impedance: 68 kOhm differential
- Current Accuracy: +/-0.14% (excluding external sensor error)
- Phase Accuracy: +/-0.2 degrees typical
Sampling Parameters
- PMon update period: 12 cycles at 60 Hz / 10 cycles at 50 Hz (200 ms)
- CPOW frame rate: 500 packets/second (64 samples per packet at 32 kHz)
Verifying Configuration
After installation, verify the factory settings are correct for your site:
- Voltage readings: Compare displayed RMS voltage against a known reference meter. If readings are off by a fixed ratio, the voltage scaling may need adjustment.
- Current readings: Apply a known load and verify current magnitude and sign. Negative power indicates reversed CT polarity.
- Phase sequence: Confirm phase angles are approximately 120 degrees apart for 3-phase systems.
- Frequency: Should match your local grid (50 Hz or 60 Hz).
If any readings are incorrect, contact support@eq.systems with your measurements and the expected values.
Next Steps
- See Data Access Guide for connecting to data streams
- See Operations & Maintenance for ongoing system monitoring
EQ Wave Data Access
Data Streams Overview
The EQ Wave provides two primary data streams via TCP sockets for monitoring:
1. PMon — Port 1535
Purpose: Processed power quality metrics
- Parameters: RMS voltage/current, power, frequency, total harmonic distortion (THD)
- Data Format: IEEE 754 float32 values
- Update Rate: Every 12 cycles at 60 Hz or 10 cycles at 50 Hz (200 ms = 5 Hz update rate)
- Bandwidth: ~1 kbps
Data includes:
- RMS voltage and current per phase (total and fundamental)
- Active power per phase (total and fundamental)
- Fundamental reactive power per phase
- Frequency
- Derived metrics (THD, apparent power, power factor) computed by the gateway
Integration Options:
- Python: Full support for power monitoring data
- Rust: Enhanced performance libraries available under NDA
- Other Languages: TCP socket compatibility
2. Waveform Data (CPOW) - Port 1534
Purpose: High-resolution continuous waveform data
- Sample Rate: 32 kHz per channel
- Channels: 7 channels per sample row
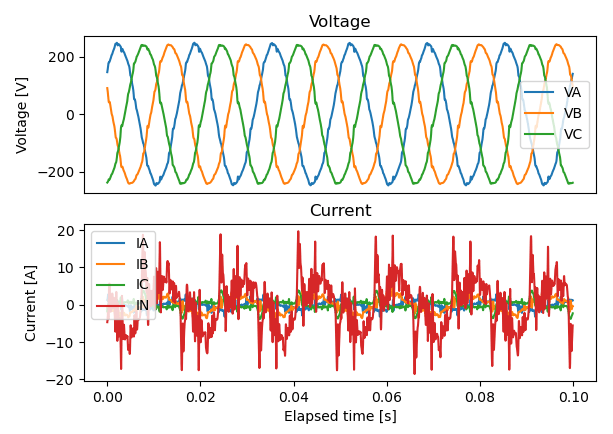
- Channel Order: IA, VA, IB, VB, IC, VC, IN (current-voltage interleaved)
- Data Format: 24-bit signed integers, little-endian
- Update Rate: 2ms packets (500 packets/second)
- Bandwidth: ~6 Mbps continuous (payload plus TCP/IP overhead)
Connection Protocol:
- Connect to IP:1534
- Send
0x01to start streaming - Receive continuous binary data
- Send
0x02to stop streaming
Performance Requirements:
- Compiled Language Required: Due to timing and buffer resource constraints, waveform data access requires compiled languages
- Recommended: Rust (core libraries available under NDA)
- Alternative: C/C++ (possible but less feature-rich)
- Not Suitable: Python or other interpreted languages for real-time waveform processing
Data Format Specifications
Waveform Data Structure
Frame Size: 1344 bytes
- 7 channels × 64 samples × 3 bytes per sample
- 24-bit signed integers, little-endian
- Channel order per sample row: IA, VA, IB, VB, IC, VC, IN
- Sample rate: 32 kHz per channel
Power Monitoring Data Structure
Frame Size: 96 bytes
- 1 × uint32 configuration word + 23 × float32 values
- IEEE 754 float32 format, little-endian
Field order:
- Configuration (uint32): system config (number of phases)
- Frequency (1 float)
- Voltage RMS (VA, VB, VC) — 3 floats
- Current RMS (IA, IB, IC) — 3 floats
- Neutral Current RMS (IN) — 1 float
- Active Power (PA, PB, PC) — 3 floats
- Fundamental Voltage RMS (VA1, VB1, VC1) — 3 floats
- Fundamental Current RMS (IA1, IB1, IC1) — 3 floats
- Fundamental Active Power (PA1, PB1, PC1) — 3 floats
- Fundamental Reactive Power (QA1, QB1, QC1) — 3 floats
Derived metrics such as THD, apparent power, and power factor can be computed from the streamed values. For example, voltage THD for phase A = √((VA² − VA1²) / VA1²). EQ Watch computes and stores these derived metrics automatically.
Integration
Power Monitoring (PMon) — Python
The recommended way to access power monitoring data is through the equser Python package (GitHub · PyPI), which is pre-installed on every gateway.
# Live power monitoring display
equser pmon live --ip 192.168.10.10

# Record PMon data to Parquet files
equser pmon record --ip 192.168.10.10 --directory ./data
The equser package also provides a Python API for programmatic access. Run equser --help on the gateway or see the GitHub README for details.
Waveform Data (CPOW) — Compiled Binaries
Due to the high bandwidth (~6 Mbps continuous) and strict timing requirements of the CPOW stream, waveform data access requires compiled-language clients with careful buffer management. EQ Watch includes pre-built binaries for CPOW acquisition (Debian packages available for multiple platforms). Contact support@eq.systems for integration options.
Other Languages and Environments
Any environment with TCP socket support can connect to the PMon stream on port 1535 (e.g., MATLAB, LabVIEW, Node.js). See the data format specifications above for the 96-byte frame structure. The open-source equser package serves as a reference implementation for parsing and framing.
Platform Integration
For enterprise deployments, EQ Watch provides:
- Long-term waveform and metrics storage
- REST API and WebSocket access for custom applications
EQ Sight provides real-time visualization, event monitoring, and interactive investigation.
See the EQ Watch API Reference for REST and WebSocket endpoint details.
Data Quality Considerations
Network Requirements
- Minimum Bandwidth: ~6 Mbps for full waveform streaming
- Latency: <10ms recommended for real-time applications
- Packet Loss: <0.1% for optimal data quality
- Buffer Management: Implement application-level buffering for network variations
Troubleshooting Data Integration
Connection Issues
- Verify network connectivity to device IP
- Ensure device is powered and LINK and ACT LEDs are solid green
- Try connecting with simple TCP client (telnet, netcat)
Data Quality Issues
- Monitor for missing data packets
- Check network bandwidth and congestion
- Verify data parsing matches protocol specification
- Check for endianness issues in multi-byte values
Performance Issues
- Increase TCP buffer sizes if possible
- Implement application-level buffering
- Use multiple threads for concurrent data streams
- Consider data reduction techniques if bandwidth is limited
EQ Wave Operations and Maintenance
This guide covers routine operation verification and maintenance procedures for the EQ Wave sensor.
Normal Operation
Expected LED and data status:
- Both LINK and ACT LEDs solid green
- EQ Sight shows live voltage and current updating
- Voltage readings within ±5% of nominal system voltage
- Current readings reasonable for monitored load
- Power readings (kW, kVAR, kVA) consistent with load
Startup behavior:
- Both LEDs flash red briefly after power is applied
- LINK LED turns solid green when fiber optic link is established with endpoint (typically media converter)
- ACT LED turns solid green when actively transmitting data
- Data appears in EQ Sight shortly after ACT LED is green
If LEDs are not solid green or data is not updating in EQ Sight, see the Troubleshooting Guide for LED status reference and diagnostic procedures.
Measurement Verification
Voltage Readings:
- Should match known system voltages within ±0.5%
- 3-phase systems: Phases should be balanced within ±2% in symmetrical systems
- Phase angles approximately 120° apart for 3-phase
Current Readings:
- Should correlate with monitored load
- Verify CT polarity: Active power positive for consuming loads, negative for generation
- Phase angles should align with voltage (near 0° for resistive loads, leading/lagging for reactive loads)
Power Readings:
- Real power (kW) should match load nameplates and expected consumption
- Reactive power (kVAR) should correlate with load type (motors, transformers produce reactive power)
- Power factor should be reasonable for load type (0.9–1.0 for resistive, 0.7–0.9 for inductive)
If Readings Incorrect:
- Verify CT ratios configured correctly in gateway
- Check CT polarity (reverse if power negative for consuming load)
- Verify voltage scaling matches system voltage
- Compare with portable reference meter to confirm sensor accuracy
- See Configuration Guide for CT ratio and polarity configuration
Routine Operation Checks
Check during facility inspections:
- LEDs: Both solid green
- Data: Updating normally in EQ Sight
- Readings: Consistent with expected load
Frequency: When accessing electrical panel for other maintenance (no dedicated inspection required).
No active monitoring required: The sensor operates continuously without user intervention. EQ Sight can be configured to send alerts if communication is lost or measurements are outside the expected range.
Maintenance Procedures
The EQ Wave sensor is a solid-state device with no moving parts, batteries, or user-serviceable components. Maintenance requirements are minimal.
Fiber Optic Connection Care
Normal Operation:
- When disconnecting POF cable, install red dust cover on OptoLock® connector to prevent contamination
- No routine fiber cleaning is necessary
Troubleshooting Only: If optical link fails after all other troubleshooting (LEDs not solid green):
- De-energize sensor per lockout/tagout procedures
- Disconnect POF cable from OptoLock connector
- Inspect fiber ends for contamination or wear
- If contamination suspected: Blow out OptoLock connector with low-pressure dry compressed air
- If fiber ends worn or damaged: Re-cut fiber ends using POF cutting tool (clean perpendicular cut required)
- Reconnect cable ensuring full insertion into OptoLock receptacle
- Install red dust cover when connector not in use
- Re-energize and verify LINK LED turns solid green once fiber is connected and ACT LED turns solid green when data transfer resumes
Note: Fiber optic connection issues are rare. If problems persist, see Troubleshooting Guide.
Terminal Connection Inspection
When required: During annual facility electrical inspection.
Procedure:
- De-energize circuits per lockout/tagout procedures
- Visually inspect all push-in connectors for:
- Corrosion or oxidation
- Signs of overheating (discoloration)
- Wire insulation degradation
- Verify all green visual indicators are extended (wire fully seated)
- Replace any degraded wiring
- Re-energize and verify normal operation (LEDs solid green, data updating in EQ Sight)
Frequency: Annually or per facility maintenance schedule.
Mounting Hardware Verification
3M Dual Lock Adhesive:
- Inspect adhesive bond for peeling or degradation
- Verify sensor remains securely attached
- If bond fails: Clean surface with isopropyl alcohol and apply new adhesive strips
DIN Rail Clips:
- Verify clips fully engaged on rail
- Ensure sensor does not move when pulled downward
- If loose: Remove and re-install clips
Magnetic Mount:
- Verify magnets hold sensor firmly to mounting surface
- Check for corrosion between magnet and surface
- Ensure sensor does not slide when subjected to normal vibration
Frequency: Annually or if sensor subjected to unusual vibration or mechanical shock.
Firmware Updates
v1 Devices: Require return to factory for firmware updates. Contact support@eq.systems to initiate RMA process. Typical turnaround: 7–10 business days.
v2 Devices (when available): Field-updatable via EQ Sight or configuration port.
Update Notifications: Firmware updates distributed via email to registered users. Updates are optional unless addressing security vulnerabilities or critical issues.
Device Service Life and Replacement
Expected Service Life: 10 years of continuous operation under normal conditions.
Design and Components:
- Solid-state design with no moving parts or wear mechanisms
- Electrolytic capacitors in AC/DC power supply (if AC powered) and supercapacitors have typical 10-year service life
- All other components are solid-state electronics with indefinite service life under normal conditions
Replace sensor if:
- Physical damage to enclosure or terminals
- Lightning strike or electrical surge damage
- LEDs remain red or off after power cycling
- Measurements drift beyond acceptable limits (verify with known reference first)
- Approximately 10 years of continuous operation
Replacement procedure: See Installation Guide for new sensor installation. Existing wiring and fiber optic cable can typically be reused.
Calibration
EQ Wave v1 uses theoretical scaling ratios for voltage and current measurement. No per-unit factory calibration is performed. The ADC and analog front-end provide high intrinsic accuracy (see v1 Specifications), so theoretical ratios are sufficient for most applications.
Verification: Compare sensor readings with a portable reference meter annually or per facility requirements.
If readings are outside expected accuracy:
- Verify correct CT ratios and voltage scaling are configured
- Verify voltage and current sensor connections
- Check for loose terminal connections
- Compare with multiple reference instruments to rule out reference meter error
- Contact support@eq.systems if sensor fault is suspected
For environmental specifications (temperature, humidity, vibration ratings), see v1 Specifications. For environment-related troubleshooting, see the Troubleshooting Guide.
EQ Wave Troubleshooting
This guide provides systematic troubleshooting procedures for common issues. For emergency support, contact (415) 562-5251.
LED Status Indicators
The EQ Wave has two status LEDs that provide quick diagnostic information:
| LED | Pattern | Meaning | Action |
|---|---|---|---|
| LINK | Solid Green | Optical link established with endpoint | Normal operation |
| LINK | Off | No optical link | Check fiber cable and media converter |
| ACT | Solid Green | Device active and transmitting data | Normal operation |
| ACT | Off | Device inactive | Check power and connections |
| Both | Red flash at startup | Boot sequence | Normal — both turn solid green shortly |
| Both | Solid green | Powered, awaiting connection | Connect fiber to media converter |
| Both | Off | No power | Check power supply and connections |
For detailed diagnostics beyond basic LED status, check the EQ Sight web interface on the gateway for device status and data stream health.
Quick Diagnostic Checklist
Before starting detailed troubleshooting:
- Check LED status using table above
- Verify media converter LEDs (both amber and green illuminated)
- Test network connectivity: ping sensor at 192.168.10.10 or gateway at 192.168.10.2
- Review data streams via EQ Sight or direct TCP connection
Power and System Issues
No Power - Both LEDs Off
Symptoms:
- LINK and ACT LEDs completely dark (no red startup flash)
- Device unresponsive
- No network connectivity
Troubleshooting Steps:
-
Check Power Source:
- Verify power supply voltage (5–36V DC or 85–528V AC)
- Measure voltage at power input terminals
- Verify power supply can deliver at least 2.4W DC or 3.3W AC
- Try alternative power input method
-
Check Connections:
- Verify power terminal connections are tight
- Check for corrosion or damage
- Ensure proper wire sizing (12–20 AWG)
- Verify polarity for DC inputs
-
Test with Alternative Power:
- Try USB power for testing (limited functionality)
- Use known good power supply
- Check for blown fuses in external power supply
Expected Resolution: LINK and ACT LEDs should both illuminate solid green
Intermittent Power Issues
Symptoms:
- LEDs flicker or go off intermittently
- System restarts unexpectedly
- Data interruptions
Troubleshooting Steps:
-
Check Power Quality:
- Monitor input voltage stability
- Look for voltage sags or surges
- Check for loose connections
- Verify power supply capacity under load
-
Environmental Factors:
- Check operating temperature (-40°C to +70°C)
- Ensure adequate ventilation
- Look for vibration or shock
- Check for moisture ingress
-
Load Analysis:
- Verify power consumption 3.3W AC / 2.4W DC typical
- Check for excessive network load
- Monitor internal temperature
- Review system diagnostics
Network Connectivity Issues
No Network Connection
Symptoms:
- Cannot ping device IP address
- LINK LED off
- No data streaming
Troubleshooting Steps:
-
Physical Connection:
- Verify fiber optic cable connections
- Check media converter power and status LEDs
- Test fiber cable with optical power meter
- Try known good fiber cable
-
Fiber Optic Issues:
- Clean fiber connectors with lint-free wipes
- Inspect connector end faces for damage
- Ensure proper connector seating
- Check for cable bending radius violations
-
Network Configuration:
- Verify IP address settings
- Check subnet and gateway configuration
- Default IP is 192.168.10.10 (fixed)
-
Media Converter Issues:
- Verify media converter power
- Check Ethernet connection to switch
- Test with different media converter
- Verify 100Base-FX compatibility
Expected Resolution: LINK LED solid green, ACT LED solid green, device responds to ping
Cannot Access Data Ports
Symptoms:
- Network connectivity works (ping successful)
- TCP connections to ports 1534/1535 fail or timeout
Troubleshooting Steps:
-
Network Verification:
- Verify device responds to ping at 192.168.10.10
- Test TCP connection with telnet or netcat (ports 1534, 1535)
- Verify computer IP address is in same subnet (192.168.10.x)
-
Device Issues:
- Power cycle the device
- Verify both LINK and ACT LEDs are solid green
- Test from a different computer
Data Connection Timeouts
Symptoms:
- Ping works but data streaming fails
- Intermittent data loss
- Application cannot connect to data ports
Troubleshooting Steps:
-
Port Accessibility:
- Verify TCP ports 1534, 1535 are open
- Test with telnet or netcat
- Monitor network statistics
-
Bandwidth Issues:
- Check network bandwidth availability
- Monitor system diagnostics for buffer overflows
- Reduce data streaming rate if necessary
- Optimize network infrastructure
-
Application Issues:
- Increase application TCP buffer sizes
- Implement proper error handling
- Check application processing speed
- Monitor client-side resources
Measurement Issues
Inaccurate Voltage Readings
Symptoms:
- Voltage readings significantly different from reference
- Inconsistent measurements
- Wrong scaling
Troubleshooting Steps:
-
Connection Verification:
- Verify voltage reference connections (V0 terminal)
- Check voltage divider scaling configuration
- Ensure proper grounding of measurement circuit
- Verify input voltage is within specified range
-
Configuration Check:
- Verify system voltage configuration
- Check PGA gain settings
- Confirm voltage divider ratios
- Review calibration factors
-
Signal Quality:
- Check for EMI/RFI interference
- Verify cable shielding integrity
- Look for ground loops
- Monitor signal-to-noise ratio
Acceptance Criteria: ±0.2% accuracy for RMS voltage
Inaccurate Current Readings
Symptoms:
- Current readings don’t match applied current
- Wrong power factor calculations
- Phase angle errors
Troubleshooting Steps:
-
CT/Rogowski Setup:
- Check CT polarity and direction
- Verify CT ratio configuration matches actual CT
- Ensure CT secondary is properly terminated
- Check for proper CT burden resistance
-
Wiring Verification:
- Verify CT primary direction (arrow toward load)
- Check secondary connections (I+ and I-)
- Ensure CT secondary never left open
- Verify consistent CT orientations
-
Configuration:
- Check CT ratio settings in configuration
- Verify Rogowski coil sensitivity (if applicable)
- Review current sensor calibration
- Check input range settings
Acceptance Criteria: ±0.5% magnitude, ±0.2° phase accuracy
Phase Angle Errors
Symptoms:
- Incorrect power factor readings
- Wrong phase sequence
- Inconsistent phase relationships
Troubleshooting Steps:
-
Wiring Check:
- Verify all voltage and current connections
- Check for consistent CT orientations
- Ensure common voltage reference (V0) connection
- Verify timing synchronization between channels
-
System Configuration:
- Check system type setting (Delta, Wye, etc.)
- Verify phase sequence (A-B-C rotation)
- Review nominal frequency setting
- Check sampling synchronization
-
Signal Quality:
- Monitor for noise and interference
- Check cable lengths and routing
- Verify grounding practices
- Look for timing synchronization issues
Expected Results:
- Phase sequence: A→B→C positive rotation
- Phase angles: ∠VA = 0°, ∠VB = -120°, ∠VC = +120°
Data Quality Issues
Missing Data Packets
Symptoms:
- Intermittent data gaps
- Application reports missing data
- Inconsistent update rates
Troubleshooting Steps:
-
Network Analysis:
- Check network bandwidth and congestion
- Monitor packet loss statistics
- Verify network switch performance
- Test network infrastructure
-
System Health:
- Check system status via EQ Sight
- Monitor for network congestion
- Review recent configuration changes
- Contact support if persistent
-
Application Optimization:
- Increase TCP buffer sizes if possible
- Implement application-level buffering
- Optimize data processing speed
- Use multiple threads for data handling
Data Corruption
Symptoms:
- Invalid data values
- Checksum errors
- Parsing failures
Troubleshooting Steps:
-
Protocol Verification:
- Verify data parsing matches protocol specification
- Check for endianness issues in multi-byte values
- Validate data structure alignment
- Review protocol documentation
-
Network Issues:
- Monitor for network errors
- Check cable integrity
- Look for EMI/RFI interference
- Test with different network equipment
-
If Issues Persist:
- Document specific error patterns
- Note when corruption occurs (specific data types, times)
- Contact support with error examples
- Provide network configuration details
Environmental Issues
Temperature-Related Problems
Symptoms:
- Performance degradation in extreme temperatures
- Thermal shutdown events
- Measurement drift
Troubleshooting Steps:
-
Temperature Monitoring:
- Check internal temperature readings
- Verify operating range (-40°C to +70°C)
- Monitor ambient temperature
- Check for heat sources nearby
-
Ventilation:
- Ensure adequate clearance around device
- Check for blocked ventilation
- Verify mounting orientation
- Consider additional cooling if needed
-
Environmental Protection:
- Check for direct sunlight exposure
- Verify enclosure IP rating
- Look for heat-generating equipment nearby
- Consider thermal insulation if needed
Vibration and Shock Issues
Symptoms:
- Intermittent connection problems
- Mechanical damage
- Mounting hardware loosening
Troubleshooting Steps:
-
Mounting Inspection:
- Check mounting hardware tightness
- Verify DIN rail or panel mount security
- Look for mechanical stress
- Check for proper mounting orientation
-
Vibration Sources:
- Identify vibration sources
- Consider vibration isolation
- Check equipment mounting
- Monitor acceleration levels
-
Connection Security:
- Verify all electrical connections
- Check for wire fatigue
- Ensure strain relief adequate
- Consider flexible connections
System Recovery Procedures
Power Cycle
If the device behaves erratically or becomes unresponsive:
- Disconnect power
- Wait 10 seconds
- Reconnect power
- Verify both LEDs flash red briefly, then turn solid green
Firmware Issues
v1 devices require return to factory for firmware updates. Contact support to initiate the RMA process if:
- Device behaves unexpectedly after a firmware change
- System is unresponsive and power cycling does not resolve the issue
Getting Additional Help
Information to Collect
Before contacting support, gather:
- Device serial number and firmware version
- LED status patterns (refer to table above)
- Complete error description: when it started, how often it occurs, what changed
- Network configuration: IP address, gateway, subnet
- Installation details: power source, sensor types, environmental conditions
- Recent changes: configuration updates, firmware updates, wiring changes
EQ Wave v1
The EQ Wave v1 is a CPOW power quality sensor designed for permanent installation in electrical panels. It captures gapless, high-resolution voltage and current waveforms and streams them to an EQ Gateway for storage and analysis.
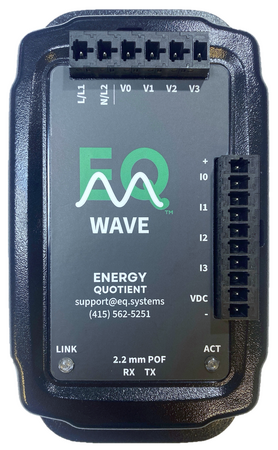
Key Characteristics
- Measurement: 3-phase voltage (up to 600V RMS) + 4 current channels via external transducers or Rogowski coils
- Resolution: 24-bit, 32 kHz, 7-channel simultaneous-sampling delta-sigma ADC
- Two-stage isolation: Fiber optic networking + internal capacitive barrier (5 kV)
- Self-powered: AC input (85–528V) or DC input (5–36V, v1.2)
- Industrial: -40°C to +70°C, fanless, rugged polycarbonate enclosure
- Data streams: Continuous CPOW waveforms (port 1534) + power metrics (port 1535) over TCP
- Network: 100Base-FX over plastic optical fiber (POF) via Firecomms OptoLock® connector
- Processor: ARM Cortex-M4 with FPU, real-time operating system with TCP/IP networking
Platform Integration
The sensor connects to an EQ Gateway running EQ Watch for gapless data recording, long-term storage, and APIs. EQ Sight provides real-time visualization. EQ Syntropy adds optional AI analytics.
Hardware Versions
- v1.0 (2023): Initial prototype with core measurement and streaming
- v1.1 (2024): Dual high-voltage resistor divider for improved safety; timing-optimized GNSS receiver footprint
- v1.2 (2025): Current pilot version. Expanded voltage range (600V), supercapacitor backup power (~8 seconds), improved analog conditioning, DC power input (5–36V)
All v1 hardware versions share the same firmware and network interface.
Current Limitations (v1 Firmware)
- Fixed IP: 192.168.10.10 with no DHCP (network configuration planned for future firmware)
- No remote firmware update: v1 requires physical access for firmware changes. Remote parameter updates are planned.
- No on-device storage: microSD hardware is present but not yet supported in firmware
- No GNSS timestamping: Hardware option available but not installed on current units; firmware support planned
EQ Wave v2 (production hardware) details are being finalized. Contact support@eq.systems if you would like to discuss upcoming capabilities and specifications.
More Information
- Installation Guide — wiring, safety, and setup procedures
- Data Access Guide — protocol specifications and integration
- Specifications — complete technical specifications
- Operations & Maintenance — ongoing system monitoring
EQ Wave v1 — Technical Specifications
This document contains detailed technical specifications for the EQ Wave v1 series for system integration and deployment planning.
For an overview of v1 architecture and capabilities, see EQ Wave v1.
Hardware Architecture
See EQ Wave v1 Overview for hardware version history, key characteristics, and platform integration.
Key Components
Hardware
- Dedicated power quality measurement IC
- 24-bit, 32 kHz, 7-channel, simultaneous-sampling ΔΣ ADC
- 101 dB signal-to-noise ratio (SNR), ~16.5-bit effective number of bits (ENOB)
- Built-in signal processing including calculation of many PQ metrics
- ARM Cortex-M4 processor with FPU
- Optical networking at 100 Mbps (100Base-FX)
- Firecomms OptoLock® connector
- IEEE 1588 precision time protocol (PTP) support
- Precision timing mode GNSS receiver (optional)
- Wide-range AC-to-DC power supply module (optional)
- microSD card interface (optional)
Software Stack
Sensor Firmware
- Operating System: Real-time operating system with TCP/IP networking
- Application Layer: Custom interrupt-driven, low-latency (< 2 ms) data acquisition system for concurrent services on separate TCP ports:
- PMon on port 1535
- CPOW on port 1534
- Standard Metrics (expandable upon request):
- RMS voltage and current (all phases)
- Active, reactive, and apparent power
- Power factor and displacement power factor
- Frequency measurement
- Total harmonic distortion (THD)
- Individual harmonic components
- Voltage and current unbalance
- Peak voltage and current values
Gateway Software — EQ Watch
EQ Wave sensors stream data to a gateway running EQ Watch, the edge software platform that handles data collection, storage, preprocessing, and the data API. EQ Sight provides the web-based visualization interface. Both run on all gateway hardware (Compulab, Raspberry Pi, or customer-provided Linux computers).
For AI-powered analytics (anomaly detection, root cause analysis, predictive models), EQ Syntropy runs on a GPU-equipped computer at the edge or on Energy Quotient’s managed servers.
See the Deployment Options for gateway hardware choices, AI capabilities, and data storage options.
Future Features
- Modbus TCP server
- MQTT publisher
- Zenoh protocol support for remote configuration and control
- PTP support
- GNSS timestamp integration
- Runtime query engine (patent pending)
- Over-the-network firmware update
Electrical Specifications
Voltage Input Specifications
- Nominal Voltage: 480V (600V RMS max per UL 1059 Group D)
- Voltage Measurement Range (V1, V2, V3 relative to V0): up to 600V RMS
- Voltage Ratings:
- 300V under UL 1059 Group C
- Designed to IEC 61010-1 CAT III / pollution degree 3 (not formally qualified)
- Input Impedance: 4 MΩ (Vx to V0)
- Voltage Division Factor: 1335.833333
- Supported Systems:
- 600V Delta (line-referenced) with PGA=1, 57.4% overvoltage margin
- 480V Delta (line-referenced) with PGA=1, 96.8% overvoltage margin
- 600/346V 4-wire Wye (center-referenced) with PGA=2, 36.3% overvoltage margin
- 480/277V 4-wire Wye (center-referenced) with PGA=2, 70.4% overvoltage margin
- 240V (line-referenced) with PGA=2, 96.8% overvoltage margin
- 240/120V 3-wire (neutral-referenced) with PGA=4, 96.8% overvoltage margin
Current Input Specifications
- Input Architecture: Instrumentation amplifiers with configurable termination
- Input Impedance: 68 kΩ (differential)
- Default Termination: 68 kΩ resistor to ground on each side
- Default Configuration: Current transducers (optimized for voltage output sensors)
- Supported Sensors:
- Current transducers (default configuration)
- Current transformers (CT secondaries - configurable upon request)
- Rogowski coils (configurable upon request)
- High-impedance inputs (configurable upon request)
- Recommended Current Transducers: Socomec Accu-CT series
- Typical CT: 5A secondary
- Typical Rogowski: 100mV/A output
Data Acquisition
- ADC Resolution: 24-bit Sigma-Delta
- ENOB: ~16.5 bits typical (based on 101dB SNR specification)
- Sample Rate: 32 kHz for each of 7 channels (simultaneous across channels)
- Frequency Range: 45–65 Hz
- Channels: 3 voltage + 4 current (7 total)
- Latency: Sub-cycle latency
- Streams: Simultaneous streams of AC metrics and waveform data
Measurement Accuracy
- Voltage Accuracy: ±0.18% (pre-calibration)
- Current Accuracy: ±0.14% (pre-calibration, excluding external sensor error)
- Thermal Drift:
- Voltage: up to 70 ppm/K total
- Current: up to 35 ppm/K total
Power Supply
- Power Supply Voltage: 85–528 VAC or 5–36 VDC (VDC +/-)
- DC Input: 5–36V DC (v1.2+)
- AC Input (v1.2 with PS1):
- Voltage Range: 85–528V AC (L-N or L-L configuration)
- Nominal: 85–480V AC (PS1 module rated)
- Protection: 2A slow blow fuse included
- Power Consumption:
- 3.3W AC typical
- 2.4W DC typical
- Additional Load: 4 MΩ per voltage line (69 μA @ 277V = 19 mW per line)
- Backup Power (v1.2): Supercapacitor backup providing ~8 seconds of operation
- DC Output (optional): Up to 1.7W available when PS1 is populated (12 VDC export if AC-powered)
Isolation & Safety
- Voltage Isolation: 2.1 kV RMS to ground
- Insulation Resistance: >1 GΩ
- Galvanic Isolation: Voltage front-end is galvanically isolated from backend electronics
- Ground Isolation: No internal ground leakage current; ground connection limited to isolated section
- Safety Standards: All voltage connections isolated from DC input/output, ground, and CT inputs
- Two-Stage Measurement Isolation: Through fiber optics and internal barrier
Environmental
- Operating Temperature: -40°C to +70°C (based on lowest component rating of 80°C with 10°C internal rise)
- Enclosure: Polycarbonate, industrial grade
- Form Factor: Compact (140 × 89 × 41 mm)
- Mounting: DIN rail or wall mount
Expansion Features (Hardware Present)
- microSD Card Interface: Hardware present but not yet supported in firmware
- GNSS Receiver: Not installed, but footprint available for castellated component
- Can be field-installed for precision time synchronization
- Firmware support planned for future releases
Communication
- Primary Interface: 100Base-FX over 2.2 mm duplex plastic optical fiber (POF)
- Alternate: 100Base-TX Ethernet via media converter
- Protocols: TCP/IP
- Data Services:
- TCP port 1535: Power monitoring metrics (PMon)
- TCP port 1534: Continuous point-on-wave data (CPOW)
- Performance:
- Power monitoring with 10/12 cycle updates
- Continuous waveform streaming at 2ms intervals
- <2ms latency for streaming data
- Gap-less data recording capability
- Low-latency ½ cycle reporting
- Protocol: Custom low-latency binary protocol optimized for real-time data streaming
Installation & Connection Guidelines
POF Cable Installation (OptoLock Connector)
- Cable Preparation: Make a clean, straight cut using the supplied cutting tool
- Webbing Split: Split the cable webbing approximately 1 cm from the end
- Connector Release: Pull out the OptoLock connector retainer
- Cable Insertion: Push the prepared cable fully into the connector
- Secure Connection: Press the retainer back in to secure the cable
4-Wire Wye Systems (3-Phase with Neutral)
- Voltage Connections: Connect neutral to V0, lines to V1, V2, V3
- Power Supply: Connect L/L1 to L1 terminal, N to N/L2 terminal
- Wiring Recommendation: Use separate wires for AC power supply and voltage measurement to avoid spurious readings from ~3W power draw
3-Wire Delta Systems
- Voltage Connections: Connect L1 to V1, L2 to both V0 and V2, L3 to V3
- Firmware Configuration: Contact EQ to update firmware for L-L measurement reporting (soon to be remotely configurable)
Split-Phase Systems (2-Phase with Neutral)
- Voltage Connections: Connect neutral to V0, lines to V1 and V2 (leave V3 unused)
- Configuration: Similar to 4-wire Wye but with only two active phases
- Typical Applications: North American residential 240V/120V systems
Single-Phase Systems
- With Neutral Available: Connect neutral to V0, line to V1 (leave V2, V3 unused)
- Without Neutral (2-Wire): Connect L1 to V1, L2 to V0 (like Delta configuration without third wire)
- Configuration: Similar to Wye or Delta depending on neutral availability
Grounding & Noise Performance
- Optimal Grounding: Connect VDC- (minus) to Ground for improved noise performance
- Ground Isolation: Unlike other power quality meters, no internal ground leakage current
- Ground Connection: Ground limited to isolated section after voltage measurement only
Firmware Roadmap (v1.x Series)
Near-Term Features
- Remote Configuration: EEPROM-based settings storage enabling dynamic sensor parameter adjustment without reflashing firmware
- Enhanced Data Services: Standardized port allocation (1534=CPOW, 1535=PMon, 1536=Console, 1537=SMon)
- GNSS Integration: Firmware support for optional GNSS receiver module
Planned Features
- Zenoh Protocol: Remote configuration and control via Zenoh-Pico
v1.x Limitations
- Remote Firmware Updates: Not supported in v1
- Remote configuration and parameter updates supported
- Physical access required for firmware updates
- Advanced Features: Some features reserved for v2.0 architecture
v2.0 Migration Path
- Remote Flash Updates: Full over-the-network firmware update capability
- Enhanced Processing: FPGA-based architecture enables advanced features
- Expanded Memory: Support for larger feature sets and local data storage
Additional Resources
Related Documentation
- Firecomms OptoLock® series (POF connector)
- POF cable: Mitsubishi ESKA® 2.2 mm duplex (FF-GHCP 4002), available from FiberFin in North America
- Media converter kit (FF-FYENT-KSU): includes media converter, USB power cable, USB power supply, POF cutting tool, and Cat5e patch cable; also available from FiberFin
EQ Wave v2 Series
This document describes the EQ Wave v2 series currently in development. All specifications, features, and timelines are subject to change. For current production specifications, see EQ Wave v1 Series.
The EQ Wave v2 adds FPGA-based signal processing, configurable sampling rates, complete measurement-to-network isolation, and real-time control output to the existing v1 platform.
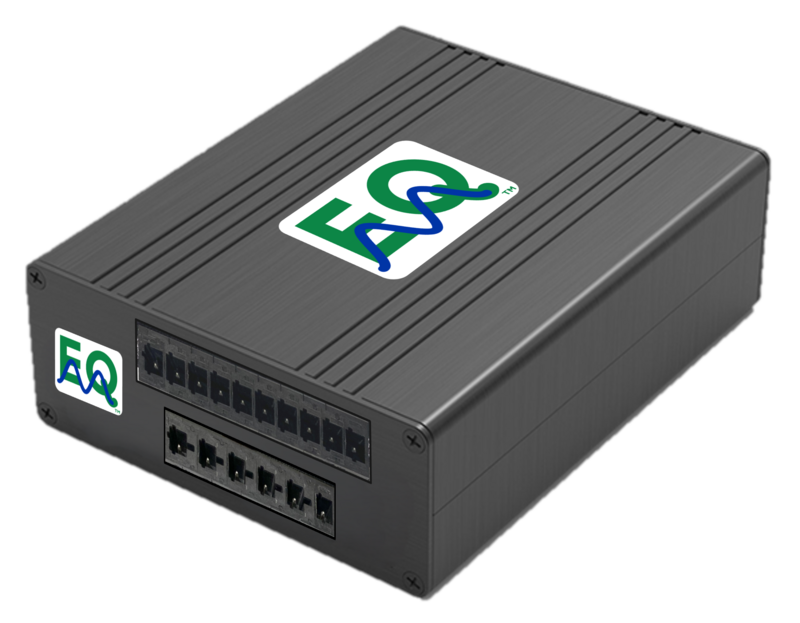
EQ Wave v2: Compact aluminum enclosure with dual network interfaces (conceptual rendering)
Architecture
The v2 architecture centers on a programmable FPGA signal processing pipeline alongside the MCU, enabling application-specific configuration:
- Configurable sampling rates: 4–64 kHz (4–16 kHz for energy management, 32–64 kHz for transient capture and motor analysis)
- Adaptive filtering: FPGA filters configurable per deployment environment
- Deterministic control path: FPGA-to-network path for sub-millisecond control loops
- Software-defined: Sampling, filtering, and control algorithms adaptable by settings or firmware updates
Key Changes from v1
1. Processing: Dual-Core MCU + FPGA
- Dual-core ARM Cortex-M33 @ 150 MHz
- Integrated FPGA for parallel signal processing
- Enables on-device anomaly detection, harmonic analysis, and control logic independent of the gateway
2. Integrated Isolated ADCs with FPGA Processing
- Integrated isolated delta-sigma ADCs with complete 5 kV isolation
- FPGA-based configurable sampling (4–64 kHz)
- Programmable gain (1× to 128×) and oversampling for ENOB optimization (14–18 bit)
Configuration examples by application:
- Energy management: 17–18 bit ENOB at 4–16 kHz
- Power quality monitoring: 15–16 bit ENOB at 32 kHz (IEC 61000–4-30 Class A compliance)
- Motor control / VFD analysis: 14–15 bit ENOB at 64 kHz with < 1 ms latency
One hardware platform serves multiple applications; field-reconfigurable as requirements change.
3. Modular Power Architecture
- Separate DC input and DC output terminals
- Optional AC power supply board (field-installable)
- Optional GPS timing board for multi-site synchronization
- Optional EtherCAT support for industrial automation integration
DC output can power external signal conditioners, relay contacts, or other field accessories.
4. Dual Network Interfaces
- Internal Ethernet switch with dual interfaces
- POF (plastic optical fiber) for electrical isolation AND RJ45 for direct copper connection
- Field-selectable without hardware changes
- Both interfaces can operate simultaneously for redundancy or network segmentation
5. Extended Onboard Storage
- microSD card interface supporting up to 2 TB
- Compression algorithms (in development) targeting weeks to months of continuous waveform storage
- Direct data retrieval via network interface (no gateway required)
This enables standalone deployment as a walk-up fault recorder — connect with a laptop and retrieve weeks to months of continuous waveform history.
Storage capacity examples (continuous @ 64 kHz, 5–10:1 compression):
- 512 GB: 3–6 weeks
- 1 TB: 1–3 months
- 2 TB: 2–6 months
Cost context: Traditional fault recorders cost $5,000–15,000 with days/weeks of storage. EQ Wave v2 targets $2,000–3,000 (depending on configuration) with weeks to months of continuous waveform archival.
6. Aluminum Enclosure
- Aluminum housing replaces polycarbonate
- Better EMI/RFI immunity (critical near VFDs, welders, RF transmitters, medical imaging)
- Improved thermal management and mechanical protection
- DIN rail mounting: 90 mm flat or 36 mm on edge for high-density installations
Application Notes
Semiconductor fabrication: FPGA processing detects and characterizes transients < 10 μs, supporting preventive action before wafer damage.
Data centers: Real-time pattern recognition identifies pre-failure electrical signatures in power distribution equipment ahead of critical failure.
Electric utilities: GPS-synchronized monitoring enables coordinated voltage regulation and load balancing across distributed substations.
Industrial automation: EtherCAT integration enables coordinated power conditioning control with deterministic < 1 ms latency.
Comparison: v1 vs v2
| Capability | v1 Series | v2 Series | Notes |
|---|---|---|---|
| Processing | Single-core M4 @ 120 MHz | Dual-core M33 @ 150 MHz + FPGA | FPGA enables on-device analytics |
| Sampling | Fixed 32 kHz | Configurable 4–64 kHz | Application-specific optimization |
| ENOB | Fixed (~16.5 bit) | Configurable 14–18 bit | Trade resolution for speed or vice versa |
| Isolation | Front-end only | Full 5 kV measurement-to-network | Enables in-panel installation at voltage source |
| Power | Combined AC/DC input | Separate DC I/O + optional AC board | Field-configurable |
| Network | POF only | POF + RJ45 (dual interface) | Simultaneous or selectable |
| Enclosure | Polycarbonate | Aluminum (extruded) | EMI immunity, thermal performance |
| DIN Width | 90 mm | 90 mm flat or 36 mm on edge | High-density option |
| Optional Modules | GPS (not connected) | GPS, EtherCAT, AC PSU | Add capabilities as needed |
| Edge Processing | Limited | Dedicated FPGA | On-device anomaly detection and control |
Development Status
The v2 architecture is fully specified: major components selected, PCB factored, and aluminum enclosure designed. Production prototyping and manufacturing scale-up are contingent on customer commitments or funding.
Design milestones completed:
- Component selection and architecture validation
- PCB factoring and enclosure mechanical design
- Firmware architecture and FPGA integration plan
- BOM costing and supply chain sourcing
Next steps:
- PCB layout and prototype assembly
- Bench testing and design validation
- Firmware migration and FPGA pipeline development
- Pilot deployments with early customers
- UL/FCC certification
Engagement
We are seeking partners for early adoption and co-development:
- Mission-critical facilities where power quality directly impacts operations
- Applications requiring specialized capabilities (GPS sync, EtherCAT, high-speed transient capture)
- Organizations with in-house power quality expertise for technical feedback
Contact: support@eq.systems with subject “EQ Wave v2”
EQ Watch
EQ Watch is the data foundation of the Energy Quotient platform. It runs high-bandwidth, low-latency pipelines to ingest Continuous Point-on-Wave (CPOW) and power monitoring (PMon) data from EQ Wave sensors, gap-free, with minimal memory and CPU requirements. All data is recorded locally and served to any number of concurrent consumers through flexible REST and WebSocket APIs with on-demand processing.
EQ Syntropy and EQ Sight both build on EQ Watch. Every gateway deployment includes it.
Data Pipeline
EQ Watch captures two concurrent data streams from each EQ Wave sensor:
- Continuous Point-on-Wave (CPOW): 32 kHz, 7-channel waveform data streamed at ~2 ms intervals with sub-cycle latency. No triggering, no gaps.
- Power Monitoring (PMon): Aggregated RMS voltage, current, power, power factor, frequency, harmonics, and unbalance updated every 10/12 cycles (~200 ms at 50/60 Hz).
Both streams are validated, timestamped, and written to storage in real time.
Storage
- Format: Apache Parquet columnar files, optimized for time-series analytics and direct access from Python, Rust, and other tools
- Capacity: Approximately 50 GB/day for a typical 3-phase deployment (losslessly compressed; varies with channel count)
- Flexible media: Removable USB storage (microSD via USB adapter, USB flash drives, external SSDs) for easy capacity expansion and field data transfer
- Automatic rotation: Oldest data is reclaimed when storage fills, ensuring uninterrupted recording
- Data lake sync: Optional synchronization to the EQ data lake for centralized access and long-term archival (subscription service)
See Storage Media for capacity planning, recommended hardware, and swap procedures.
APIs
- REST API: Query months or years of waveform history with sub-cycle precision. Supports time-range selection, downsampling, and bulk export.
- WebSocket streaming: Live waveform and spectral data pushed to connected clients as it arrives. Multiple consumers can subscribe concurrently without impacting recording performance.
See the API Reference for REST endpoints, WebSocket streaming, and integration examples.
Integration
- EQ Wave sensors: Primary data source via fiber optic network (100Base-FX POF)
- Facility systems: REST API for custom integrations; additional protocol support (Modbus TCP, MQTT, DNP3) available upon request
- Enterprise tools: Data export in Parquet format for external analysis platforms and data pipelines
- Remote support: VPN connectivity for authorized remote access when enabled
Supported Gateway Hardware
See Deployment Options for the full list of supported hardware, including Compulab industrial gateways, Raspberry Pi (lab/demo), and customer-provided Linux computers.
Logs
EQ Watch writes a plain-text activity log alongside the CPOW data at cpow/cpow_daq.log. It records sensor connection events and service start/stop, useful for verifying that recording is active or diagnosing connectivity issues.
Getting Started
- Gateway Overview — hardware setup and connections
- Storage Media — capacity planning and media setup
- API Reference — REST endpoints, WebSocket streaming, and integration methods
EQ Watch API Reference
EQ Watch exposes REST and WebSocket APIs for programmatic access to power quality data. All API endpoints are served from the gateway.
Integration Methods
| Method | Description |
|---|---|
| EQ Sight | Browser-based real-time visualization and event monitoring |
| equser Python package | Data loading, live acquisition, and API client |
| REST API | HTTP-based queries for stored data (see below) |
| WebSocket | Live waveform and spectral streaming (see below) |
| Direct sensor access | TCP socket connections to EQ Wave sensor (advanced) |
Additional protocol support (Modbus TCP, MQTT, DNP3) is available upon request for SCADA/BMS integration. Contact support@eq.systems for details.
REST API
Base URL: http://[gateway-ip]:8080/api/v1/
Data query parameters: start_time (ISO 8601), end_time (ISO 8601), metrics (comma-separated), limit.
Data endpoints return Apache Arrow IPC binary format for efficient transfer. Use Arrow libraries in Python, JavaScript, Rust, or other languages to deserialize.
Device Endpoints
| Endpoint | Method | Description | Response |
|---|---|---|---|
/devices | GET | List registered devices | JSON |
/devices/{id} | GET | Device details (paths, capabilities) | JSON |
Data Endpoints
| Endpoint | Method | Description | Response |
|---|---|---|---|
/devices/{id}/pmon/data | GET | Power monitoring data | Arrow IPC |
/devices/{id}/cpow/data | GET | Continuous waveform data | Arrow IPC |
/devices/{id}/thumbnail | POST | Metric thumbnail for charting | Arrow IPC |
/query/sql | POST | SQL queries (SELECT only, default limit 30) | JSON |
Event Endpoints
| Endpoint | Method | Description | Response |
|---|---|---|---|
/events | GET | List power quality events | JSON |
/events/{id} | GET | Event details | JSON |
/events/stream | GET | Real-time event notifications | SSE |
/events/today | GET | Events from today | JSON |
/events/last7days | GET | Events from past 7 days | JSON |
/events/last30days | GET | Events from past 30 days | JSON |
System Endpoints
| Endpoint | Method | Description | Response |
|---|---|---|---|
/system/hostname | GET | Gateway hostname | JSON |
/health | GET | Health check | JSON |
Example: Python with Arrow
import pyarrow.ipc as ipc
import requests

# Fetch power monitoring data
url = "http://192.168.1.100:8080/api/v1/devices/wave-001/pmon/data"
resp = requests.get(url, params={"start_time": "2025-06-15T12:00:00Z"})
reader = ipc.open_stream(resp.content)
table = reader.read_all()
df = table.to_pandas()
WebSocket Endpoints
For live streaming data from EQ Watch.
| Endpoint | Description | Format |
|---|---|---|
ws://[gateway-ip]:8080/api/ws/cpow_stream | Live CPOW waveform streaming | Arrow IPC batches |
ws://[gateway-ip]:8080/api/ws/spectral?device_id={id} | Real-time spectral analysis | JSON frames |
Spectral WebSocket parameters: device_id (required), fft_size (default 4096), update_rate (default 10 Hz), phase (default “va”), freq_min (default 0), freq_max (default 3000).
Custom Integration
For integration requirements beyond what is documented here, contact support@eq.systems.
EQ Sight
EQ Sight is the web-based interface for viewing and exploring power system data collected by EQ Wave sensors.
Accessing EQ Sight
EQ Sight is available through:
- Remote access: Via your assigned subdomain at
[site].pq.app(authentication required; contact support@eq.systems to add or manage users) - Local network: Directly from the gateway at
http://[gateway-ip]when connected to the same network
Contact your system administrator for your specific access URL.
Navigation
The sidebar on the left provides access to the main sections:
| Icon | Section | Purpose |
|---|---|---|
| EQ | Dashboard | System overview with facility map and event summary |
| Triangle | PQ Events | Facility map, event list, and power network views |
| Plug | Devices | Connected sensors with historical data plotting |
| Flask | JupyterLab | Advanced analysis environment (opens in new window) |
Click any icon to switch sections. The active section is highlighted in the sidebar.
EQ Sight — Dashboard
The Dashboard is the landing page in EQ Sight, accessible via the EQ icon in the sidebar.
Summary Cards
The top of the dashboard shows key performance indicators:
- Connected Devices: Number of active EQ Wave sensors
- PQ Events Today: Count of power quality events detected
- Uptime / Downtime: System availability over the last 30 days
Overview Tab
The default view provides two modes, toggled at the top:
- Device View: A facility map showing sensor locations and status. Hover over a device to see its current metrics. Click a device for quick actions (live waveform, device detail, or event analysis).
- Power Network: A single-line schematic of the electrical distribution system showing equipment status, cable loading, and power flow. Hover over any node to see voltage, current, power factor, THD, and impedance.
Device and equipment status is color-coded: green (normal), yellow (warning), red (alarm), gray (offline).
Events Tab
Shows recent power quality events organized by assignment and priority:
- Assigned To Me: Events assigned for your review, with status tracking (Pending, In Review, Analyzed, Completed)
- Saved PQ Events: Bookmarked events for follow-up
- Generated Reports: Previously generated event reports with download links
Reports Tab
A table of all generated reports with date, time, event type, and download actions.
EQ Sight — PQ Events
The PQ Events section, accessible via the triangle icon in the sidebar, provides three views for monitoring power quality across your facility.
Facility Map
The default view shows a map of your facility with sensors displayed at their installed locations. Each device is color-coded by status:
- Green: Healthy, no active events
- Yellow: Warning-level events detected
- Red: Critical events requiring attention
Hover over a device to see a summary of its current metrics. Click a device for quick actions: view live waveforms, open the device detail page, or jump to event analysis.
List View
Displays devices sorted by event priority, with the most critical issues at the top. Each device card shows:
- Device name and location
- Count of events by severity (Critical, High, Medium, Low)
- Quick action buttons for live waveform, device detail, and event analysis
Expand a device card to see individual events with type, priority, and timestamp.
Power Network
An interactive single-line schematic of the electrical distribution system. Shows:
- Equipment nodes (utility feeds, transformers, switchgear, MCCs, panels, loads)
- Cable connections with color-coded loading (green < 70%, yellow 70-90%, red > 90%)
- Animated power flow direction (toggleable)
Hover over any node for detailed metrics: voltage, current, power factor, THD, impedance, and status.
Event Reports
Click on an individual event to open the Event Report page. From there you can:
- Review event details (type, priority, device, timestamp)
- Add context about what was happening at the time
- Generate an analysis report with technical findings and recommendations
EQ Sight — Devices
The Devices section, accessible via the plug icon in the sidebar, shows connected EQ Wave sensors and provides access to historical data.
Device Grid
The main view displays a card for each connected sensor. Each card shows:
- Device name
- Power quality status indicator (green = compliant, yellow/red = events detected)
- A thumbnail chart of the selected metric over time
Use the metric selector at the top to choose which measurement is displayed on the cards (e.g., voltage RMS, current RMS, active power, frequency).
Click any device card to open the device detail page.
Device Detail
The detail page provides interactive plotting of historical data from an individual sensor.
Data Modes
- PMon: Power monitoring metrics recorded every 200 ms (voltage RMS, current RMS, active/reactive/apparent power, frequency, THD, power factor)
- CPOW: Raw continuous point-on-wave data at 32 kHz for waveform-level analysis
Chart Types
For PMon data:
- Line, Area, and Stepped charts for time-series trends
- Histogram for metric distribution analysis
For CPOW data:
- Waveform: Time-domain voltage and current waveforms
- FFT/Spectral: Frequency-domain analysis showing harmonics up to the 50th (3 kHz at 60 Hz)
Controls
- Metric selector (left panel): Choose which measurements to plot; multiple metrics can be displayed simultaneously
- Chart type selector: Switch between visualization modes
- Phase toggles (CPOW mode): Select which phases (A, B, C) to display for voltage and current
Live Waveform
From either the device grid or event views, you can open a live waveform page for any sensor. This streams CPOW data in real time over WebSocket and offers two display modes:
- Triggered: Captures and queues individual cycles (1-30 cycles per capture) synchronized to zero crossings
- Free-running: Continuous scrolling waveform display
A spectrogram view is also available, showing frequency content over time with selectable phase and FFT parameters.
Single-Device Mode
When the gateway is connected to a single sensor, the Devices section shows that sensor directly with quick-action buttons for historical plotting, live waveform, and event list.
EQ Sight — JupyterLab
The JupyterLab view, accessible via the Erlenmeyer flask icon in the sidebar, provides an interactive Python environment for advanced analysis of power quality data. JupyterLab is pre-installed on EQ Gateways along with equser, an open-source Python package for working with EQ Wave data.
Overview
JupyterLab provides an interactive analysis environment for users who need to:
- Perform custom calculations on waveform data
- Create specialized visualizations
- Develop automated analysis workflows
- Export data in custom formats
Getting Started
When you open the JupyterLab tab:
- A new notebook session starts automatically
- The
equserpackage is pre-installed and ready to use - Sample notebooks in
tutorials/,analysis/, andtools/demonstrate common analysis patterns
You can also install equser on any computer with pip install equser to work with exported data or connect to a gateway remotely.
Working with CPOW Waveform Data
Load continuous point-on-wave (CPOW) parquet files directly from the gateway’s storage:
from equser.data import load_cpow_scaled

# Load a CPOW parquet file (32 kHz, 7 channels)
data = load_cpow_scaled('/var/lib/eq/data/cpow/20250615_120000.parquet')

# Scaled voltage and current arrays are ready to use
print(f"Phase A voltage range: {data['VA'].min():.1f} to {data['VA'].max():.1f} V")
print(f"Start time: {data['start_time']}")
print(f"Sample rate: {data['sample_rate']} Hz")
print(f"Samples: {len(data['VA']):,}")
The load_cpow_scaled() function automatically handles raw int32-to-float scaling using the vscale/iscale metadata embedded in each parquet file.
Querying Data via the REST API
The gateway exposes a REST API at port 8080. See the API Reference for endpoint details.
Power Monitoring Data (Arrow IPC)
from equser.api import api_get_arrow

# Fetch recent PMon data for a device
table = api_get_arrow('/api/v1/devices/wave-001/pmon/data', params={
    'start_time': '2025-06-15T12:00:00Z',
    'end_time': '2025-06-15T13:00:00Z',
})

# table is a pyarrow.Table; convert to pandas for analysis
df = table.to_pandas()
print(df.columns.tolist())
SQL Queries
from equser.api import api_post_sql

# Query aggregated power data via SQL
results = api_post_sql(
    "SELECT timestamp, vrms_a, vrms_b, vrms_c FROM pmon ORDER BY timestamp DESC",
    limit=100
)
Live Streaming via WebSocket
from equser.api import connect_spectral_ws

# Stream real-time spectral data
for frame in connect_spectral_ws(device_id='wave-001', phase='va', fft_size=4096):
    print(f"Frequencies: {len(frame.get('magnitudes', []))} bins")
    break  # Remove to stream continuously
Plotting Tools
The equser package includes plotting utilities for common visualizations:
from equser.plotting import PowerMonitorPlotter, WaveformPlotter
Waveform analysis helpers such as find_zero_crossings(), extract_complete_cycles(), and plot_extracted_cycles() are available for detailed cycle-level inspection.
Saving Work
Your notebooks are automatically saved to your user workspace. You can also:
- Download notebooks to your local computer
- Export results as CSV, PNG, or PDF
Resources
- Sample Notebooks: Browse the
tutorials/,analysis/, andtools/directories in the file browser - API Documentation: Built-in help via
help(equser) - equser Package: See
from equser import pmon, plotting, analysis, data, apifor available modules
Performance Notes
JupyterLab runs on the gateway alongside EQ Watch and EQ Sight. For large data analyses:
- Use time filters to limit data volume
- Consider downsampling for trend analysis
- Export large datasets for processing on dedicated workstations
EQ Syntropy
EQ Syntropy is a cyber-physical AI (CPAI) framework — AI whose reasoning is grounded in continuous physical measurement from EQ Wave sensors via EQ Watch. It runs analyses continuously (event detection, compliance monitoring) and on demand (natural language queries, root cause investigation, report generation).
Event Detection and Classification
EQ Syntropy analyzes the waveform and metric streams that EQ Watch records:
- Voltage events: Sags, swells, and transients detected per-phase with severity scoring based on depth, duration, and recovery characteristics
- Harmonic analysis: FFT-based harmonic extraction (orders 1–50+), THD computation, and distortion trending
- Frequency deviation: Grid frequency monitoring against nominal (50/60 Hz)
- Severity scoring: Events are scored on a continuous scale incorporating magnitude, duration, and impact, not just binary threshold alerts
Detected events are automatically classified, timestamped, and annotated with contextual metadata for investigation.
Standards Compliance
EQ Syntropy checks power quality against industry standards:
- IEEE 519: Voltage and current harmonic distortion limits
- SEMI F47: Semiconductor fabrication voltage immunity requirements
- ITIC/CBEMA: Voltage tolerance envelope for IT equipment (upper and lower bounds by event duration)
IEC 61000-4-30 compliance evaluation is planned.
Agentic Investigation
EQ Syntropy runs an agentic AI system that investigates power quality conditions rather than just reporting metrics:
- Semantic router: Incoming queries are analyzed and directed to the most appropriate processing pathway, whether that is a SQL analysis, a physical model, a standards lookup, or a multi-step AI investigation
- Tool execution: The AI orchestrates tools including waveform queries, statistical analysis, domain knowledge lookups, and hypothesis generation to build a complete picture
- Knowledge integration: Investigations draw on facility context (single-line diagrams, equipment specifications, maintenance history) alongside waveform evidence
- Waveform similarity search: Vector embeddings of waveform events enable “find events like this one” queries across months or years of history
- Report generation: Structured incident reports and compliance documentation with supporting waveform evidence
All AI reasoning is grounded in electrical engineering principles. Answers include specific evidence from the underlying measurements, not summaries or statistics alone.
How It Works
When you ask a question through EQ Sight or the API:
- The semantic router classifies your intent and selects the appropriate tools and models
- Relevant waveform data, events, and facility context are retrieved
- Analysis tools run against the data: SQL queries, compliance checks, trend analysis, similarity search
- The AI synthesizes findings into a response with supporting evidence from the raw waveforms
This enables questions like:
- “What caused the voltage sag at 3:47 PM yesterday?”
- “Are there any signs of equipment degradation in Building A?”
- “How does the harmonic distortion compare to last month?”
- “What’s the likely root cause of the nuisance trips on Line 3?”
- “Show me events similar to the transient on Phase B last Tuesday”
- “Are we in compliance with SEMI F47 on the fab power feed?”
Local AI Inference
EQ Syntropy runs AI models locally on the gateway or edge AI hardware. No data leaves the facility unless EQ-hosted or data lake sync is enabled. Local inference supports:
- Natural language query processing
- Event classification and enrichment
- Hypothesis generation for root cause analysis
- Waveform embedding and similarity search
EQ Syntropy vs. EQ Watch
| EQ Watch | EQ Syntropy | |
|---|---|---|
| Purpose | Data collection, storage, API, integration | Event detection, investigation, compliance, AI analytics |
| Runs on | All gateways (required) | GPU-equipped hardware or EQ-hosted servers (optional) |
| Requirements | Any supported gateway hardware | NVIDIA GPU or EQ cloud subscription |
EQ Syntropy builds on EQ Watch. EQ Watch runs on all deployments and is required.
Deployment Options
EQ Syntropy can run on:
- Edge AI Hardware: NVIDIA AGX Orin or Thor platforms for local processing
- EQ-Hosted: Energy Quotient managed servers for deployments without local GPU hardware
- Customer-Hosted: On-premises deployment for enterprise requirements
See Deployment Options for details on choosing the right configuration.
Beyond Power Quality
EQ Syntropy is initially focused on power quality and power monitoring data from EQ Wave, but its data pipeline, analytics engine, and agentic AI framework are adaptable to other continuous time-series domains — environmental monitoring, vibration analysis, process control, and other sensor-rich systems. Contact support@eq.systems to discuss ingestion and integration needs.
EQ Resolve
EQ Resolve is in development alongside EQ Wave v2 hardware. This page describes the architectural design and intended capabilities. Contact support@eq.systems for early access discussions.
Purpose
EQ Resolve is the real-time control layer of the EQ Platform. Where EQ Syntropy helps users define control objectives and design strategies, Resolve implements and coordinates those strategies as live control systems — translating high-level objectives (setpoints, schedules, optimization targets) into safe, feasible actions grounded in the electrical state measured by EQ Wave, and monitoring loop performance continuously.
Why Waveform-Level Control Matters
Traditional power meters update at 100 ms to 1 s — yet many power control applications require much faster response. Meanwhile, traditional power quality analyzers treat control-relevant data as a secondary concern, with update rates that may be as slow as 2 s and sometimes non-deterministic.
EQ Resolve operates on CPOW data and derived metrics from EQ Wave, providing:
- Sub-cycle awareness: Detect and respond to events within a single AC cycle
- Deterministic timing: Control loop execution in < 10 ms, independent of cloud connectivity
- Physics-grounded decisions: Every control action validated against real-time electrical constraints, not stale models
EQ Resolve combines full waveform-level awareness with the deterministic response time required for closed-loop control — an unusual combination, since most systems trade off one for the other.
Architecture
Resolve coordinates between EQ Syntropy (strategy), EQ Watch (metrics), EQ Wave (measurement + actuation), and external EMS/partner systems:
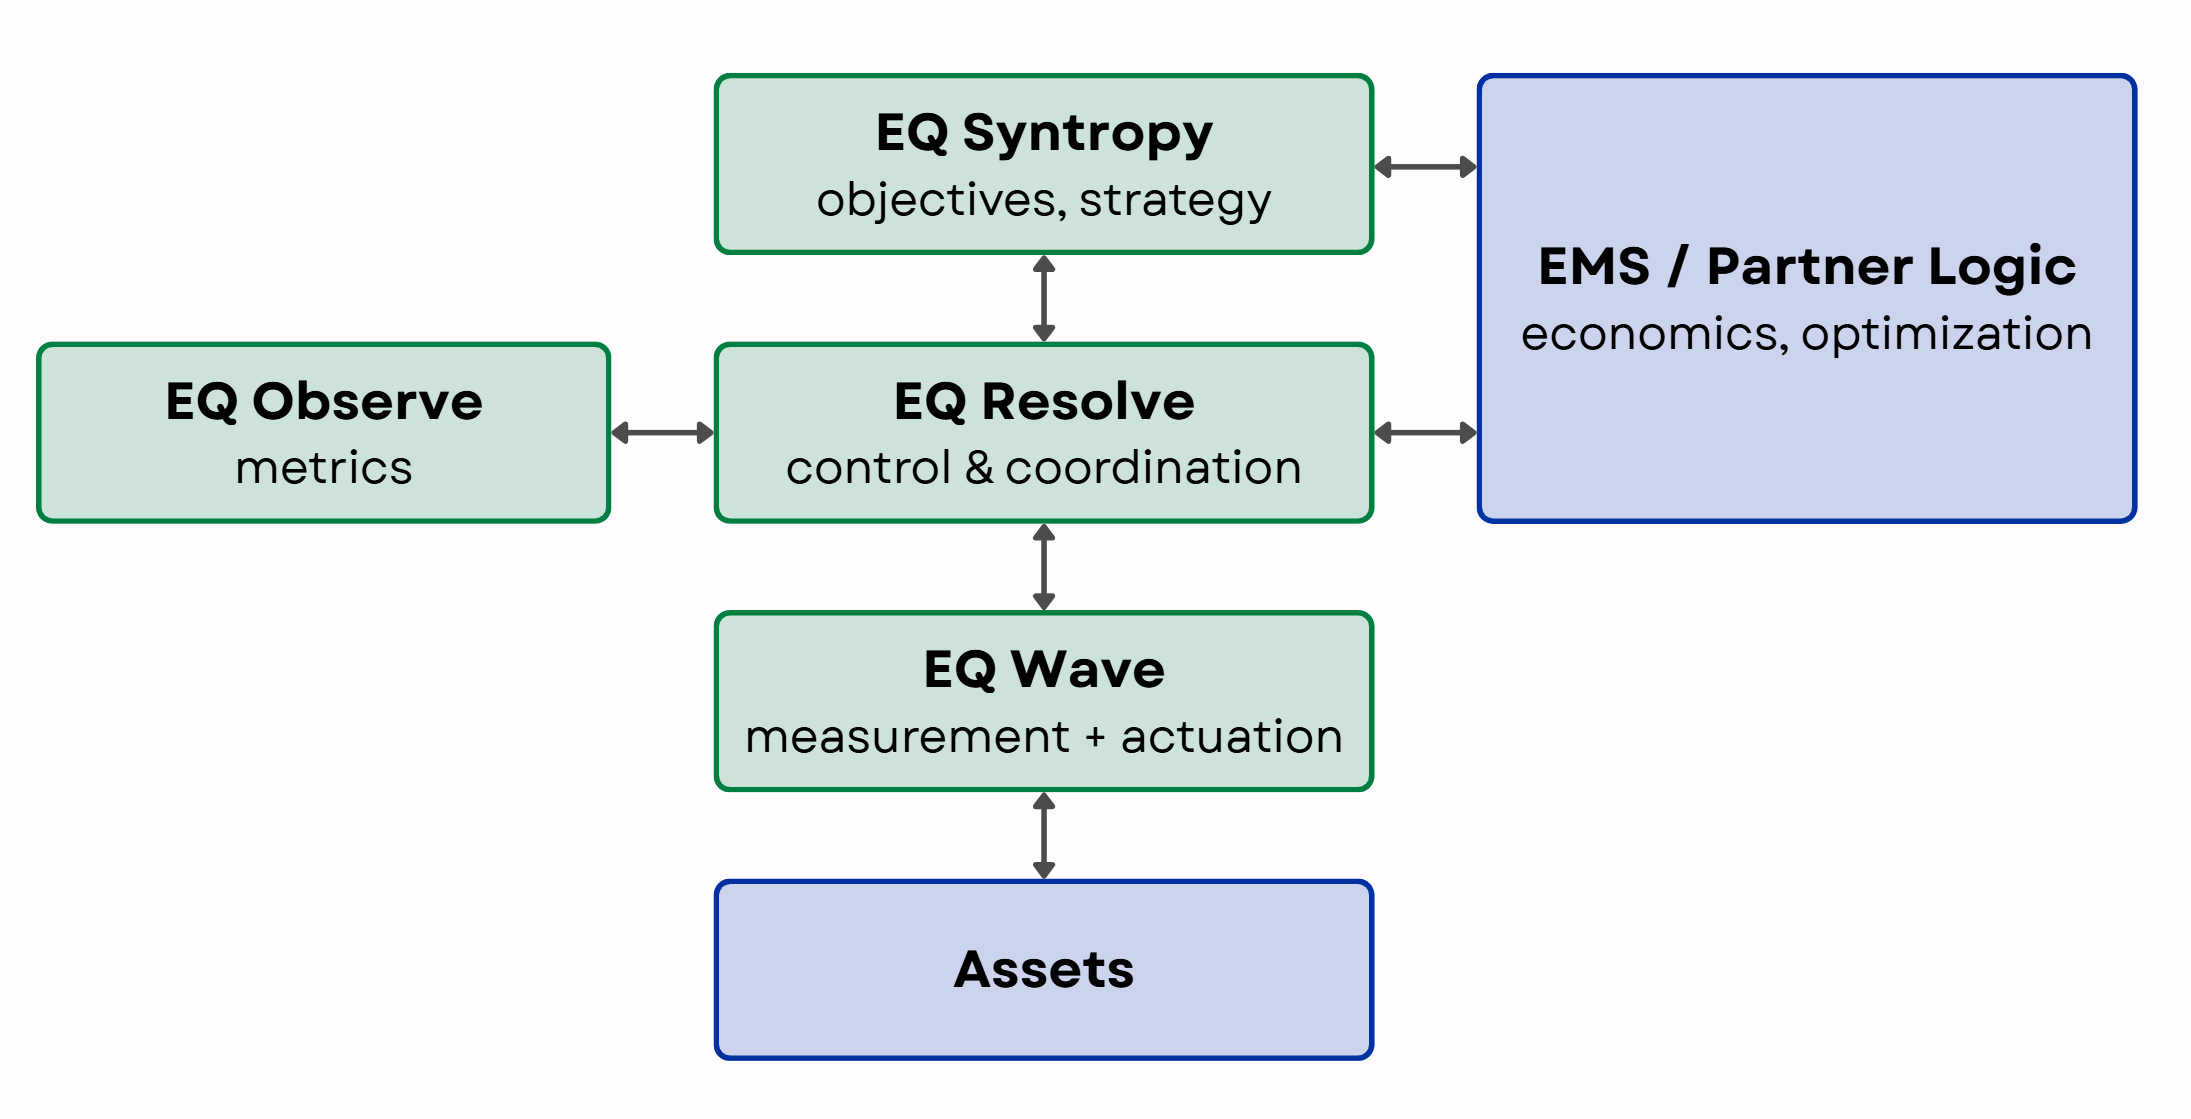
EQ Syntropy helps engineers design control strategies but is not part of the control loop itself. EQ Resolve implements those strategies as real-time control loops, typically executing at the same layer as EQ Watch. Where lower latency or deterministic timing is required, control logic can be pushed down into the EQ Wave device. EMS and partner logic (economics, optimization) interface at both the strategy and control layers.
Key Capabilities
- Real-time constraint enforcement: Validates commands against equipment limits, grid conditions, and safety envelopes before execution
- Deterministic control translation: Converts high-level objectives into stable, time-aligned control actions
- Dynamic reconciliation: Arbitrates between competing objectives, disturbances, or conflicting constraints
- Edge-autonomous operation: Fully functional on isolated or air-gapped networks with no cloud dependency
Target Applications
- Energy storage dispatch: Constraint-aware BESS charge/discharge with real-time feasibility checking
- Microgrid control: Unified sensing and control across solar, diesel, battery, and load assets
- Power factor correction: Closed-loop capacitor/reactor switching based on live waveform analysis
- Voltage regulation: Sub-cycle tap changer or inverter VAR control using CPOW feedback
- Equipment protection: Fast-acting protective responses triggered by waveform-level anomalies
Requirements
EQ Resolve requires:
- EQ Wave sensors (v2 adds lower-latency, deterministic actuation paths via FPGA)
- EQ Watch for data recording and API access
- Linux-based gateway hardware
More Information
- EQ Wave v2 Overview — additional hardware capabilities for Resolve
- EQ Syntropy — control planning, design, and high-level optimization
- Deployment Options — gateway hardware and configuration
equser — Python Toolkit
equser is the open-source Python package for working with EQ Wave data. It provides tools for loading, analyzing, and visualizing Continuous Point-on-Wave (CPOW) and power monitoring (PMon) data from EQ Wave sensors and gateways running EQ Watch.
How equser fits in
The Energy Quotient platform captures and processes power quality data across several layers:
| Component | Role |
|---|---|
| EQ Wave | Continuous waveform capture at the edge (32 kHz, 24-bit) |
| EQ Watch | Collects, stores, and streams data; hosts EQ Sight; runs EQ Syntropy on AI edge gateways |
| EQ Sight | Human–AI interface for exploration and action |
| EQ Syntropy | Edge analytics and agentic AI framework |
| equser | Python toolkit for direct data access, analysis, and scripting |
equser connects to the platform at three levels:
- Directly to an EQ Wave sensor for live power monitoring acquisition (PMon only)
- Through the EQ Watch API for historical queries, waveform snapshots, and live WebSocket streams
- Through raw Parquet files for offline analysis of CPOW and PMon data with no gateway or API required
EQ Watch data can also be synced to EQ servers for long-term retention and cross-site access (each 1-minute file is typically available within 10 seconds of completion). Contact us for details on remote data access.
This makes equser the right tool when you need programmatic access to your power quality data, whether for custom analysis, automated reporting, integration with other systems, or exploratory work in Jupyter notebooks.
Key capabilities
- Data loading — Read CPOW and PMon Parquet files with automatic scaling and timestamp parsing
- Waveform analysis — Zero-crossing detection, cycle extraction, and per-cycle metrics
- Visualization — Publication-ready matplotlib plots for voltage, current, power, and frequency trends
- EQ Watch API client — REST queries and WebSocket streaming from the gateway
- Live acquisition — Real-time PMon data collection directly from an EQ Wave sensor
- Bundled notebooks — Tutorials and analysis templates for JupyterLab
Quick example
from equser.data import load_cpow_scaled

result = load_cpow_scaled('20250623_075056.parquet')
print(f"Voltage A peak: {result['VA'].max():.1f} V")
print(f"Start time: {result['start_time']}")
Installation
pip install equser              # Data loading and analysis
pip install equser[analysis]    # Add plotting and API client
pip install equser[jupyter]     # Full notebook environment
Resources
- Full documentation — Installation, configuration, and module reference
- Source code on GitHub
- Package on PyPI
Security Architecture
Energy Quotient deployments are designed for environments where data sovereignty, network isolation, and auditability are non-negotiable. This page describes the security architecture across the platform stack.
Network Security
Zero-Trust Mesh Networking
All device-to-device communication uses a certificate-based, zero-trust mesh network built on Nebula (Apache 2.0, proven at scale). Every gateway, sensor node, and administrative device is authenticated by a CA-signed certificate that cryptographically defines its identity and network permissions.
Key properties:
- Mutual authentication on every connection — no implicit trust based on network location
- Certificate-based identity — each device has a unique certificate with embedded group memberships and an IP assigned from a private overlay range (100.64.0.0/16)
- No open inbound ports — gateways initiate outbound UDP connections with NAT traversal; no listening ports exposed to the public internet
- Cryptographic client isolation — certificate groups enforce network segmentation so one customer’s devices cannot reach another’s
- Geographically redundant lighthouses — distributed peer discovery with no single point of failure
- Open-source and auditable — no proprietary VPN components; full source available for review
Firewall
Each gateway runs UFW (Uncomplicated Firewall) with a default-deny incoming policy. Only explicitly allowed traffic is permitted:
| Port | Protocol | Service | Allowed From |
|---|---|---|---|
| 22 | TCP | SSH | Sensor subnet (192.168.10.0/24), VPN overlay (100.64.0.0/16) |
| 80 | TCP | EQ Sight | Configurable (default: LAN) |
SSH is not accessible from the public internet or the facility LAN unless a site administrator explicitly adds a firewall rule for their subnet. See SSH Access for details.
Intrusion Detection
fail2ban monitors authentication logs and automatically blocks IP addresses after repeated failed login attempts. VPN and sensor subnets are whitelisted since they are already authenticated at the certificate layer.
Physical Isolation
EQ Wave sensors connect to the gateway through plastic optical fiber (100Base-FX), providing complete electrical isolation between monitored power systems and the data network. There is no conductive path between the sensor’s measurement circuits and the gateway or facility LAN.
This two-stage isolation architecture means:
- Electrical faults on the monitored system cannot propagate to the network
- The sensor network is physically air-gapped from the facility LAN
- No routing exists between the sensor subnet (192.168.10.0/24) and the LAN interface
Authentication and Access Control
User Account Model
Each gateway provisions three user accounts with distinct privilege levels:
| Account | Role | SSH Access | Sudo | Purpose |
|---|---|---|---|---|
eqadmin | Vendor | Key-only (no password) | Full | Remote support and system maintenance |
admin | Customer | Password | Scoped | Site administration, service management, user management |
demo | Display | None (local console only) | None | Kiosk display and local demonstration |
SSH Hardening
- Key-only authentication for vendor accounts (password authentication disabled)
- AllowUsers directive restricts which accounts can log in via SSH
- Root login disabled — no direct root SSH access
- Per-device authorization — vendor SSH keys are baked into the provisioning manifest; no shared credentials across sites
Scoped Sudo
The customer admin account has scoped sudo access limited to:
- EQ service management (
systemctlfor EQ services) - Firewall rule management (
ufw) - User and group management
- Network configuration (
nmcli)
Full system-level sudo is reserved for the vendor account.
Data Sovereignty
Local-First Architecture
All waveform data is recorded and stored locally on the gateway by default. No data leaves the site unless explicitly configured:
- CPOW waveform data is written to local storage (NVMe or microSD depending on platform)
- Analytics and event detection execute on the gateway — no cloud round-trips required
- Data export is an explicit action via REST API, Parquet file transfer, or configured rsync
- Remote support access traverses the encrypted Nebula overlay and can be disabled
Air-Gap Capability
The platform operates with no cloud dependencies. For environments that require it:
- Gateways function fully without internet connectivity
- Sensor data collection, storage, and local visualization continue offline
- Nebula overlay and remote support can be disabled entirely
- All software updates can be applied via local media
Audit Trail
Three independent audit layers provide traceability:
- Certificate identity — which device connected, verified by CA-signed certificate
- Authentication logs — who logged in, tracked by SSH and system authentication
- Application logs — what was done, recorded by EQ Watch and system services
All logs are stored locally and accessible to the site administrator.
Supply Chain
- Nebula (networking): Apache 2.0, open-source, maintained by the Defined Networking team (originally developed at Slack)
- EQ Watch (data collection): Rust-based server with deterministic builds
- EQ Sight (visualization): TypeScript/React frontend served locally
- SBOM publication and formal supply chain attestation are on the 2026 roadmap
Standards Alignment
The platform’s security architecture draws on principles from these standards and frameworks. Formal certification is on our roadmap; today these reflect design choices, not compliance claims.
- NIST SP 800-82 — Guide to OT Security (network segmentation, access control, monitoring)
- IEC 62351 — Power systems communication security (authentication, access control)
- NERC CIP — Critical infrastructure protection concepts (electronic security perimeters, access management)
- Zero Trust Architecture (NIST SP 800-207) — No implicit trust; verify every connection
Contact
For security questions, vulnerability reports, or to request documentation for your compliance review, contact security@eq.systems.
Deployment Options
System Topology
Every EQ deployment places components at different points in the system:
| Location | EQ Wave | EQ Watch | EQ Sight | EQ Syntropy |
|---|---|---|---|---|
| Point of measurement | ● | |||
| On-site gateway | ● | ● | ||
| On-site AI compute (AGX Orin, Thor) | ● | ● | ● | |
| Customer server or data center | ○ | ○ | ||
| EQ-hosted server | ○ | ○ |
● included | ○ optional
EQ Wave sensors connect to the gateway via a fiber optic media converter (included with the EQ Wave package). EQ Watch and EQ Sight run on every gateway. EQ Syntropy is optional and can run locally on GPU-equipped gateway hardware, on your own servers, or on EQ-hosted infrastructure.
Gateway Hardware
The gateway runs EQ Watch and EQ Sight. Any of the following can serve as the gateway:
| Hardware | Form Factor | Use Case |
|---|---|---|
| Compulab IOT-GATE / IOT-DIN iMX8PLUS | Industrial (DIN-rail or panel mount) | Production deployments; extended temperature range |
| Toradex Verdin iMX95 + Ivy carrier | Industrial (custom carrier) | Next-generation production gateway (available Q2 2026) |
| Raspberry Pi 5 (Lab Gateway) | Single-board computer | Lab, workbench, demonstrations, smaller deployments |
| Neousys NRU-220S (NVIDIA AGX Orin) | Fanless edge AI | Gateway + edge AI in one unit |
| Advantech MIC-742 (NVIDIA Thor) | Industrial edge AI | Gateway + edge AI; extended temperature range |
| Customer-provided Linux computer | Varies | Flex deployment on customer hardware |
Managed vs. Flex:
- Managed (EQ-provided hardware): Pre-configured and ready to connect. Includes VPN connectivity for remote support. Recommended for most deployments.
- Flex (customer-provided hardware): You install EQ Watch on a Debian-based Linux computer. You manage the hardware and software updates. See Flex Deployment for setup.
Aside: The open-source equser Python package can capture PMon data (aggregated PQ metrics at 200 ms intervals) on any OS with Python, without the full EQ Watch software. This is useful for lightweight integration and research but does not provide Continuous Point-on-Wave (CPOW) recording, the REST API, or EQ Sight. See the equser documentation for details.
Data Storage
EQ Watch is storage-agnostic, supporting microSD via USB adapter, NVMe SSD, USB SSD, or network-attached storage. Optional remote storage provides long-term retention and cross-site access.
See Data Storage for local and remote storage options, and Storage Media for capacity planning and hardware recommendations.
EQ Syntropy (AI Capabilities)
EQ Syntropy is optional and independent of the gateway hardware choice:
| Option | Where It Runs | Requirements |
|---|---|---|
| No AI | — | Default for standard gateways |
| Edge AI | On the gateway | Requires GPU-equipped hardware (AGX Orin or Thor) |
| EQ-hosted AI | EQ-hosted server | Requires network connectivity and remote data storage (see above) |
| Customer-hosted AI | Customer server | Requires NVIDIA GPU (RTX 4090 class or better); see Customer-Hosted |
When AI is enabled, EQ Syntropy provides physics-informed analytics, anomaly detection, and AI-assisted event analysis. Results appear in EQ Sight.
Setup
All deployments share these setup procedures:
EQ Gateway
The EQ Gateway is a computer running EQ Watch and EQ Sight — continuous power quality data collection with built-in visualization and analysis. It connects to EQ Wave sensors via a dedicated Ethernet subnet, records CPOW and power monitoring (PMon) data to local storage, and serves the data through REST and WebSocket APIs.
Hardware Requirements
- Minimum 4 GB RAM
- Minimum 4 GB free space on root filesystem
- Two Ethernet ports (one for sensor subnet, one for facility LAN)
- Debian-based Linux OS (Debian, Ubuntu, etc.)
- Removable storage media for CPOW data (approximately 50 GB/day for a typical 3-phase deployment). Storage media must be rated for sustained high-volume writes. Do not write CPOW data to the root filesystem; use dedicated removable media. See Storage Media for endurance guidance, capacity planning, and setup.
The gateway also requires an EQ Wave sensor with media converter to collect data. These are included with the EQ Wave package; see EQ Wave Installation for details.
Network Architecture
The gateway has two Ethernet ports: one connects to your facility LAN, and the other connects to the EQ Wave sensor subnet via a media converter. The media converter bridges between Cat 5e Ethernet (100Base-TX) and plastic optical fiber (100Base-FX), providing complete electrical isolation between the sensor and gateway.
Sensor Network
- EQ Wave sensor: 192.168.10.10 (fixed IP)
- Gateway sensor interface: 192.168.10.2 (fixed IP)
- Subnet mask: 255.255.255.0
- Isolation: No routing to facility network (fiber optic isolation maintained)
Facility Network
- Gateway LAN interface: DHCP or static IP (configurable via LAN Configuration)
- EQ Watch web interface: HTTP on port 80 (proxied to backend on port 8080)
- EQ Watch REST API: Port 8080 (see API Reference)
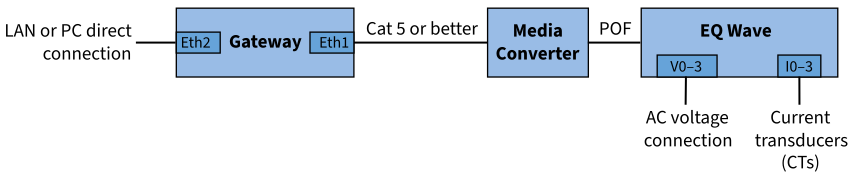
System connection diagram
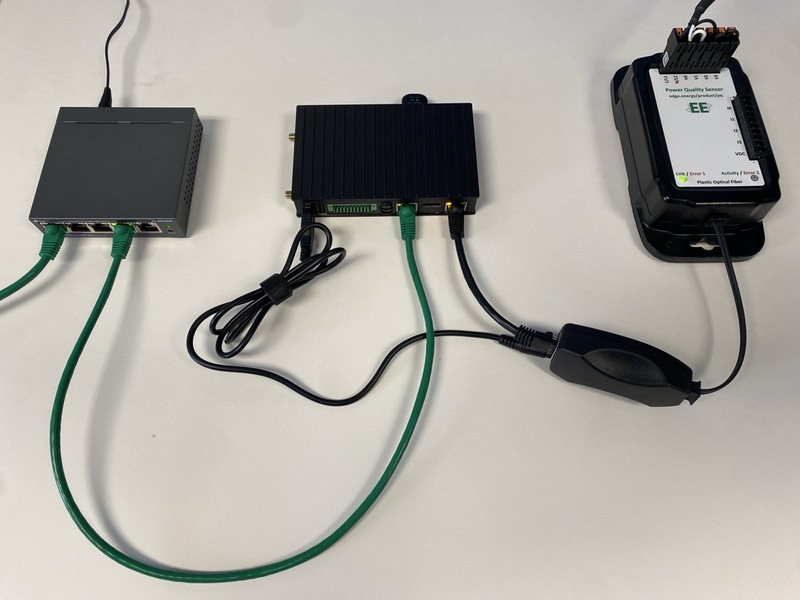
Example system setup
Power Supply
Each device in the system (gateway, media converter, EQ Wave sensor) requires exactly one power source. Do not connect multiple power sources to the same device.
EQ Wave sensor: Self-powered from the monitored AC mains (85–528V) or DC input (5–36V on v1.2).
Media converter (use one):
- USB power from the gateway
- Dedicated DC adapter
Gateway power options vary by hardware. See your platform-specific page for details.
Software
All gateways run the same EQ Watch software stack regardless of hardware platform. Capabilities include:
- REST API: HTTP-based data access (JSON and Arrow IPC formats)
- WebSocket: Live waveform and spectral streaming
- Additional protocols: Modbus TCP, MQTT, DNP3 available upon request
- Remote Support: VPN tunnel for authorized technical support (enabled by default, can be disabled)
- Network Isolation: Sensor network is physically isolated from facility LAN via fiber optic connection
Supported Platforms
| Lab Gateway | Industrial Gateway (Compulab) | Industrial Gateway (Toradex Ivy) | |
|---|---|---|---|
| Temperature range | 0°C to 50°C | -40°C to +80°C | -40°C to +85°C |
| Ethernet ports | 1 built-in + USB adapter | Dual built-in Gigabit | Dual built-in Gigabit |
| Industrial certifications | No | CE, UL | CE, FCC (pending) |
| Boot media | NVMe SSD | eMMC (internal) | eMMC (internal) |
| Data storage | NVMe SSD | microSD via USB adapter | microSD (direct slot) |
- Compulab IOT-GATE / IOT-DIN — Current production industrial gateway
- Toradex Verdin iMX95 + Ivy — Next-generation production gateway (available Q2 2026)
- Raspberry Pi 5 (Lab Gateway) — Lab, workbench, demonstrations, and smaller deployments
Industrial Gateway: Compulab IOT-GATE / IOT-DIN
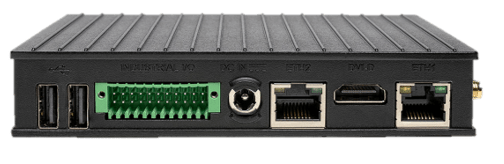
Compulab IOT-GATE-iMX8PLUS
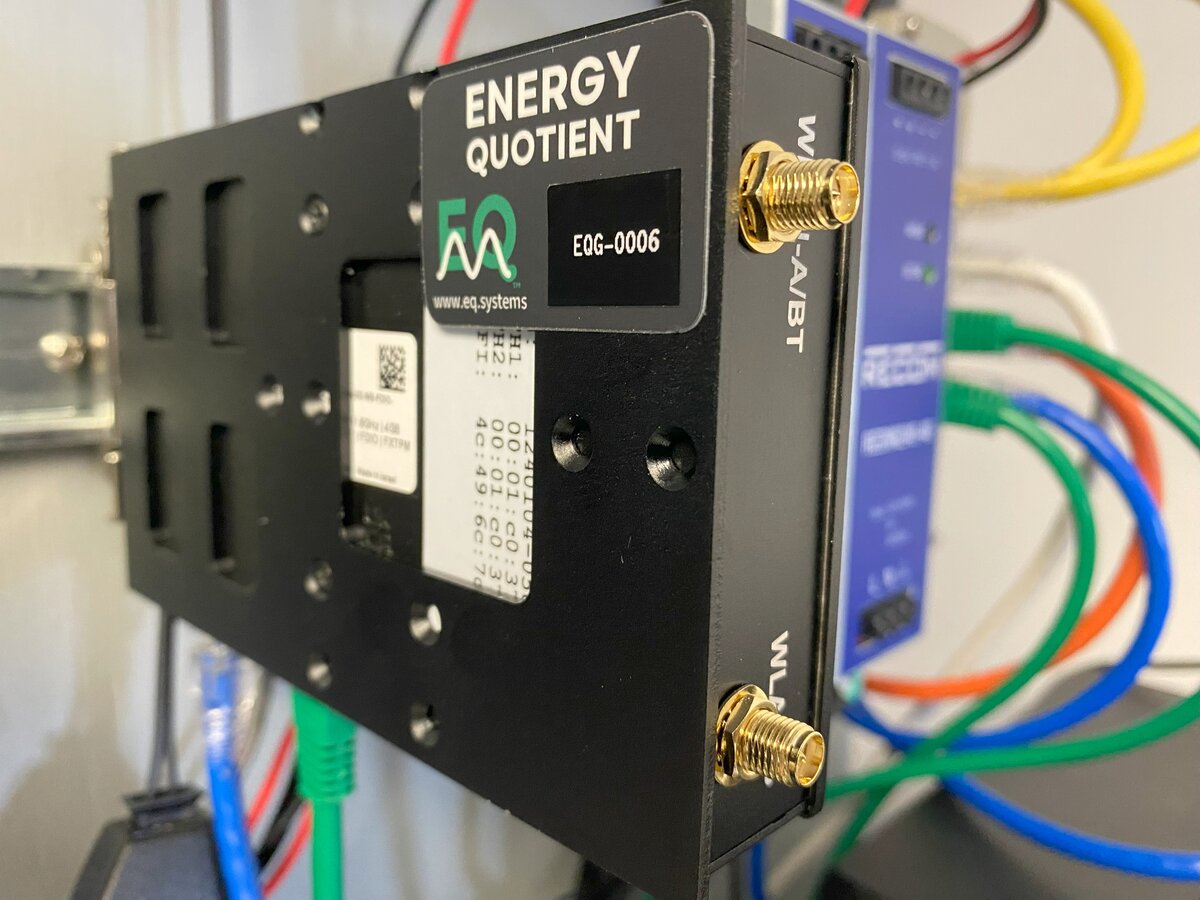
EQ Gateway DIN-rail mounted in instrumentation panel
Models
- IOT-GATE-iMX8PLUS — Panel mount
- IOT-DIN-iMX8PLUS — DIN-rail form factor
Technical Specifications
- Processor: NXP i.MX8M-Plus quad-core ARM Cortex-A53
- Power: 8–36V DC (standard) or PoE 802.3af/at (IOT-GATE only), 5–12W typical
- Operating Temperature: -40°C to +80°C (industrial grade)
- Network: Dual Gigabit Ethernet, 802.11ac dual-band WiFi, optional cellular
- Boot media: eMMC (internal)
- Data storage: microSD via USB adapter (see Storage Media)
Included Storage
- SanDisk Ultra 1.5 TB microSDXC UHS-I Memory Card — approximately one month of retention for a typical 3-phase deployment
- SanDisk MobileMate USB 3.0 microSD Reader (SDDR-B531-AN6NN)
Power Supply Options
Gateway power options (use one):
- PoE 802.3af/at via the LAN port (IOT-GATE panel-mount model only; not available on IOT-DIN)
- Wall power adapter to DC (Compulab IOTG-ACC-PSU)
- Existing DC supply (8–36V, 36W)
The left diagram below shows all possible power paths for each device. It is a reference — do not use all paths simultaneously. The right diagram shows a recommended configuration using PoE for the gateway with USB passthrough to the media converter.
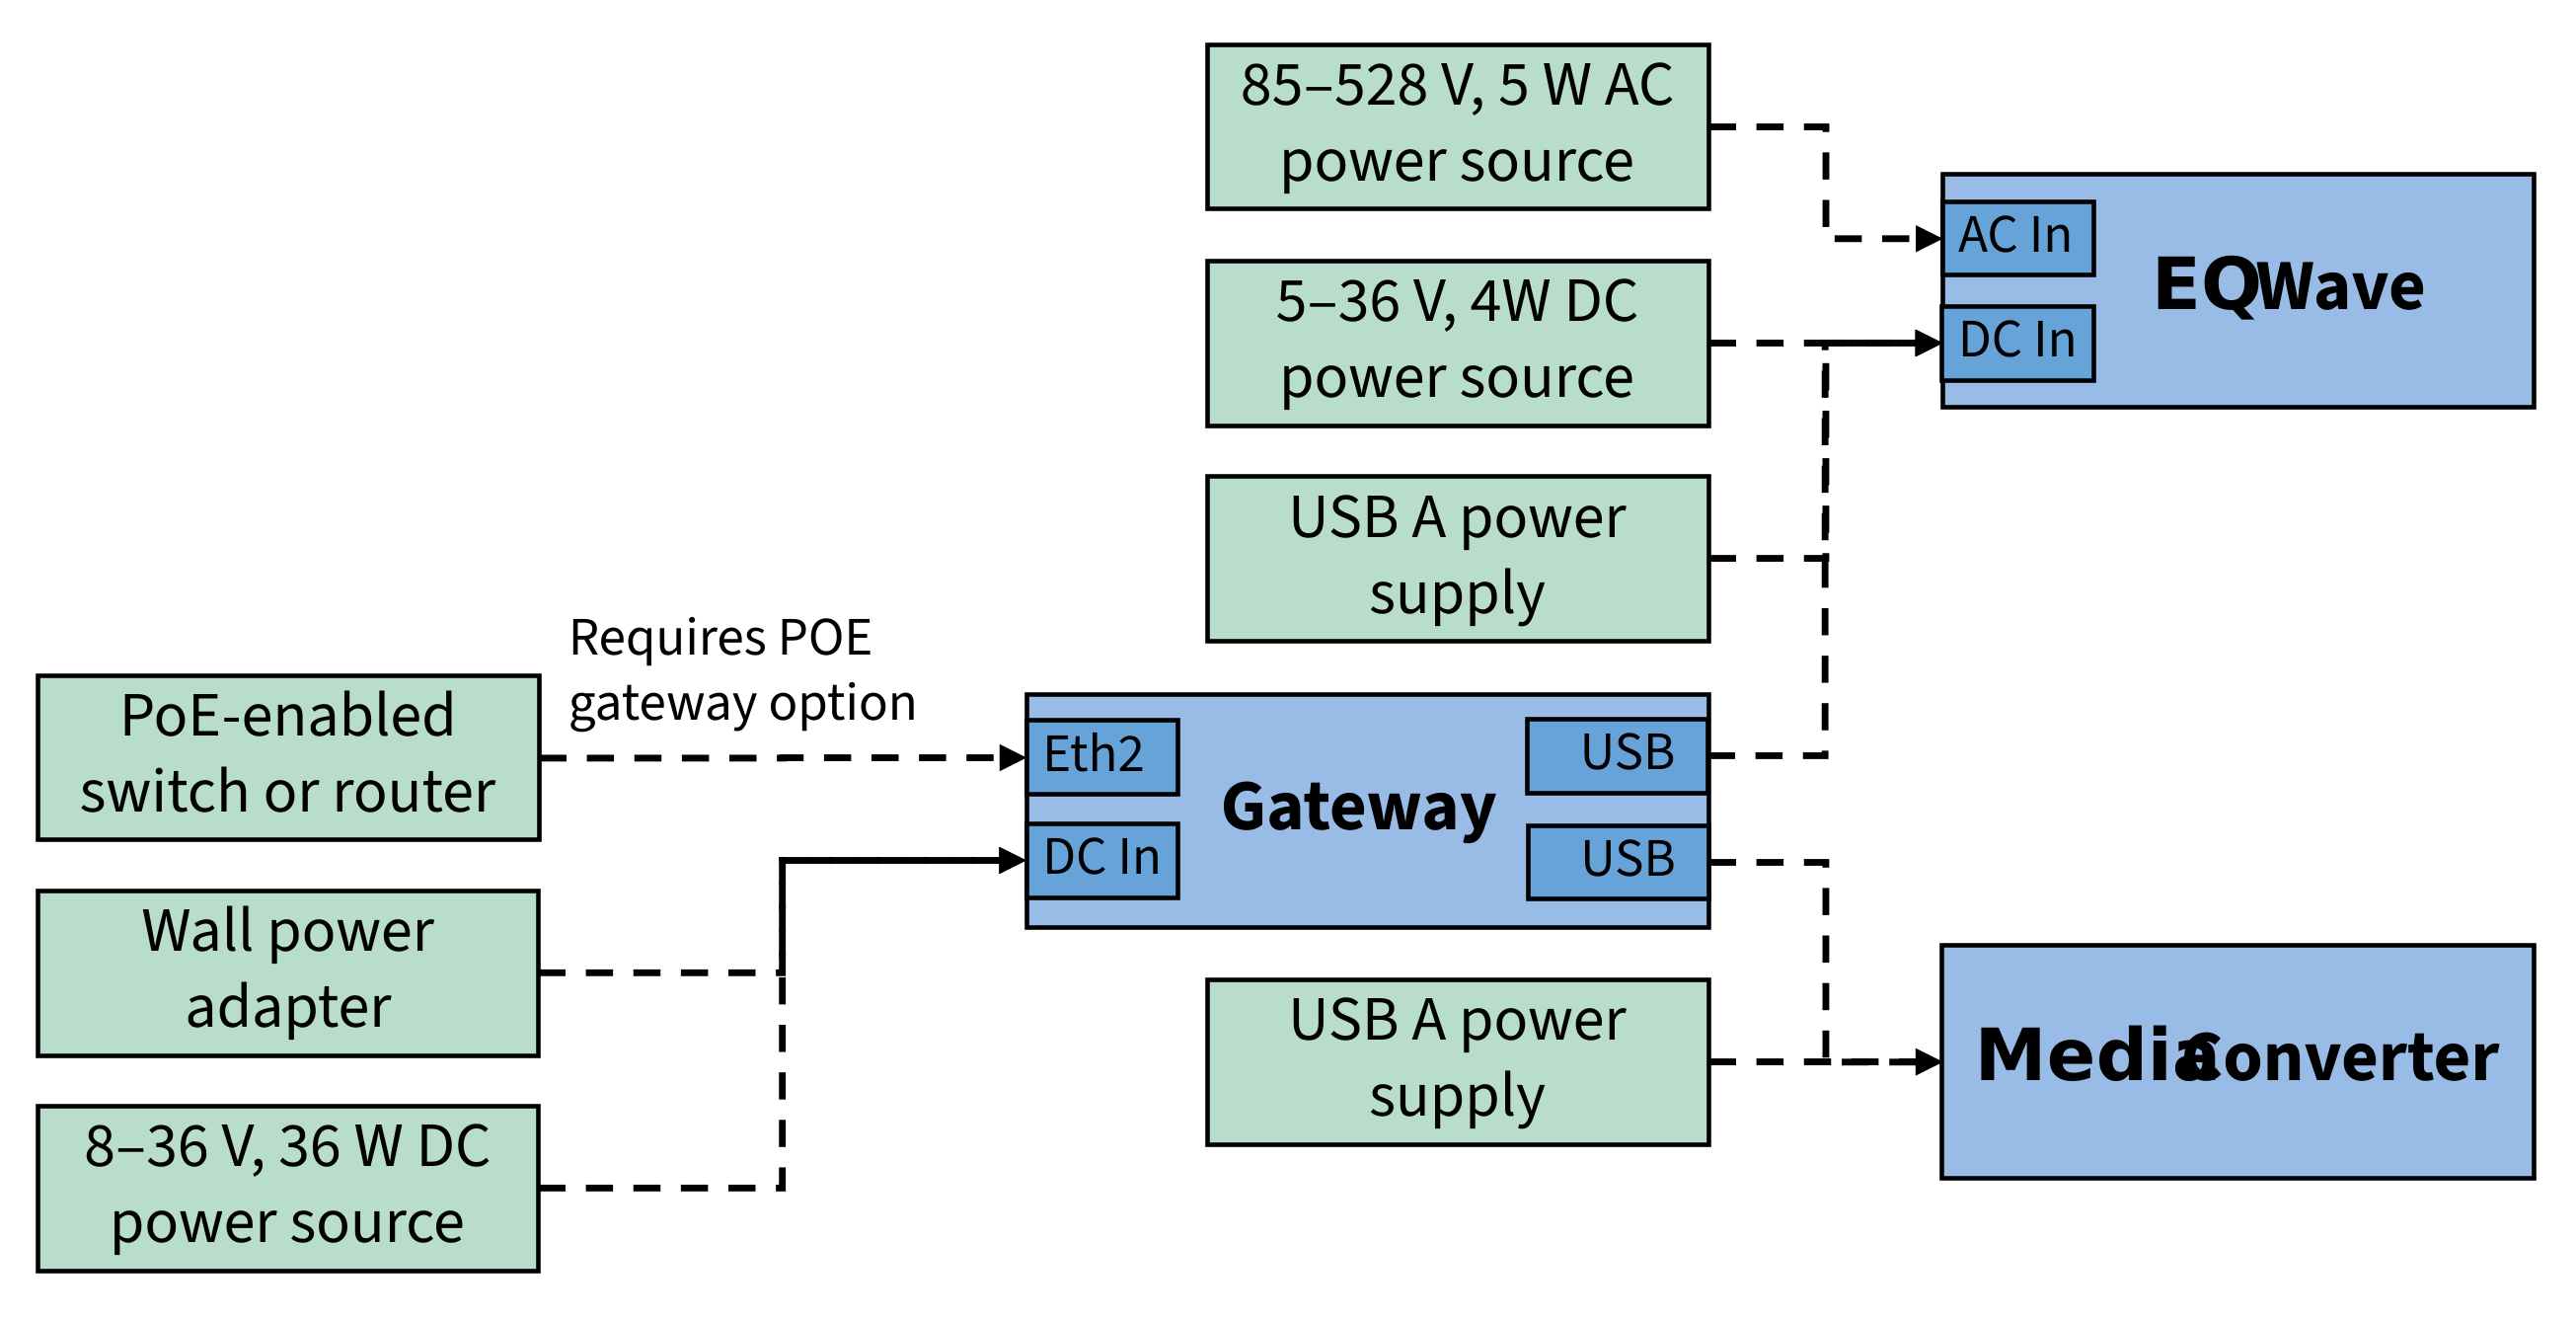
All power options by device (use one per device)
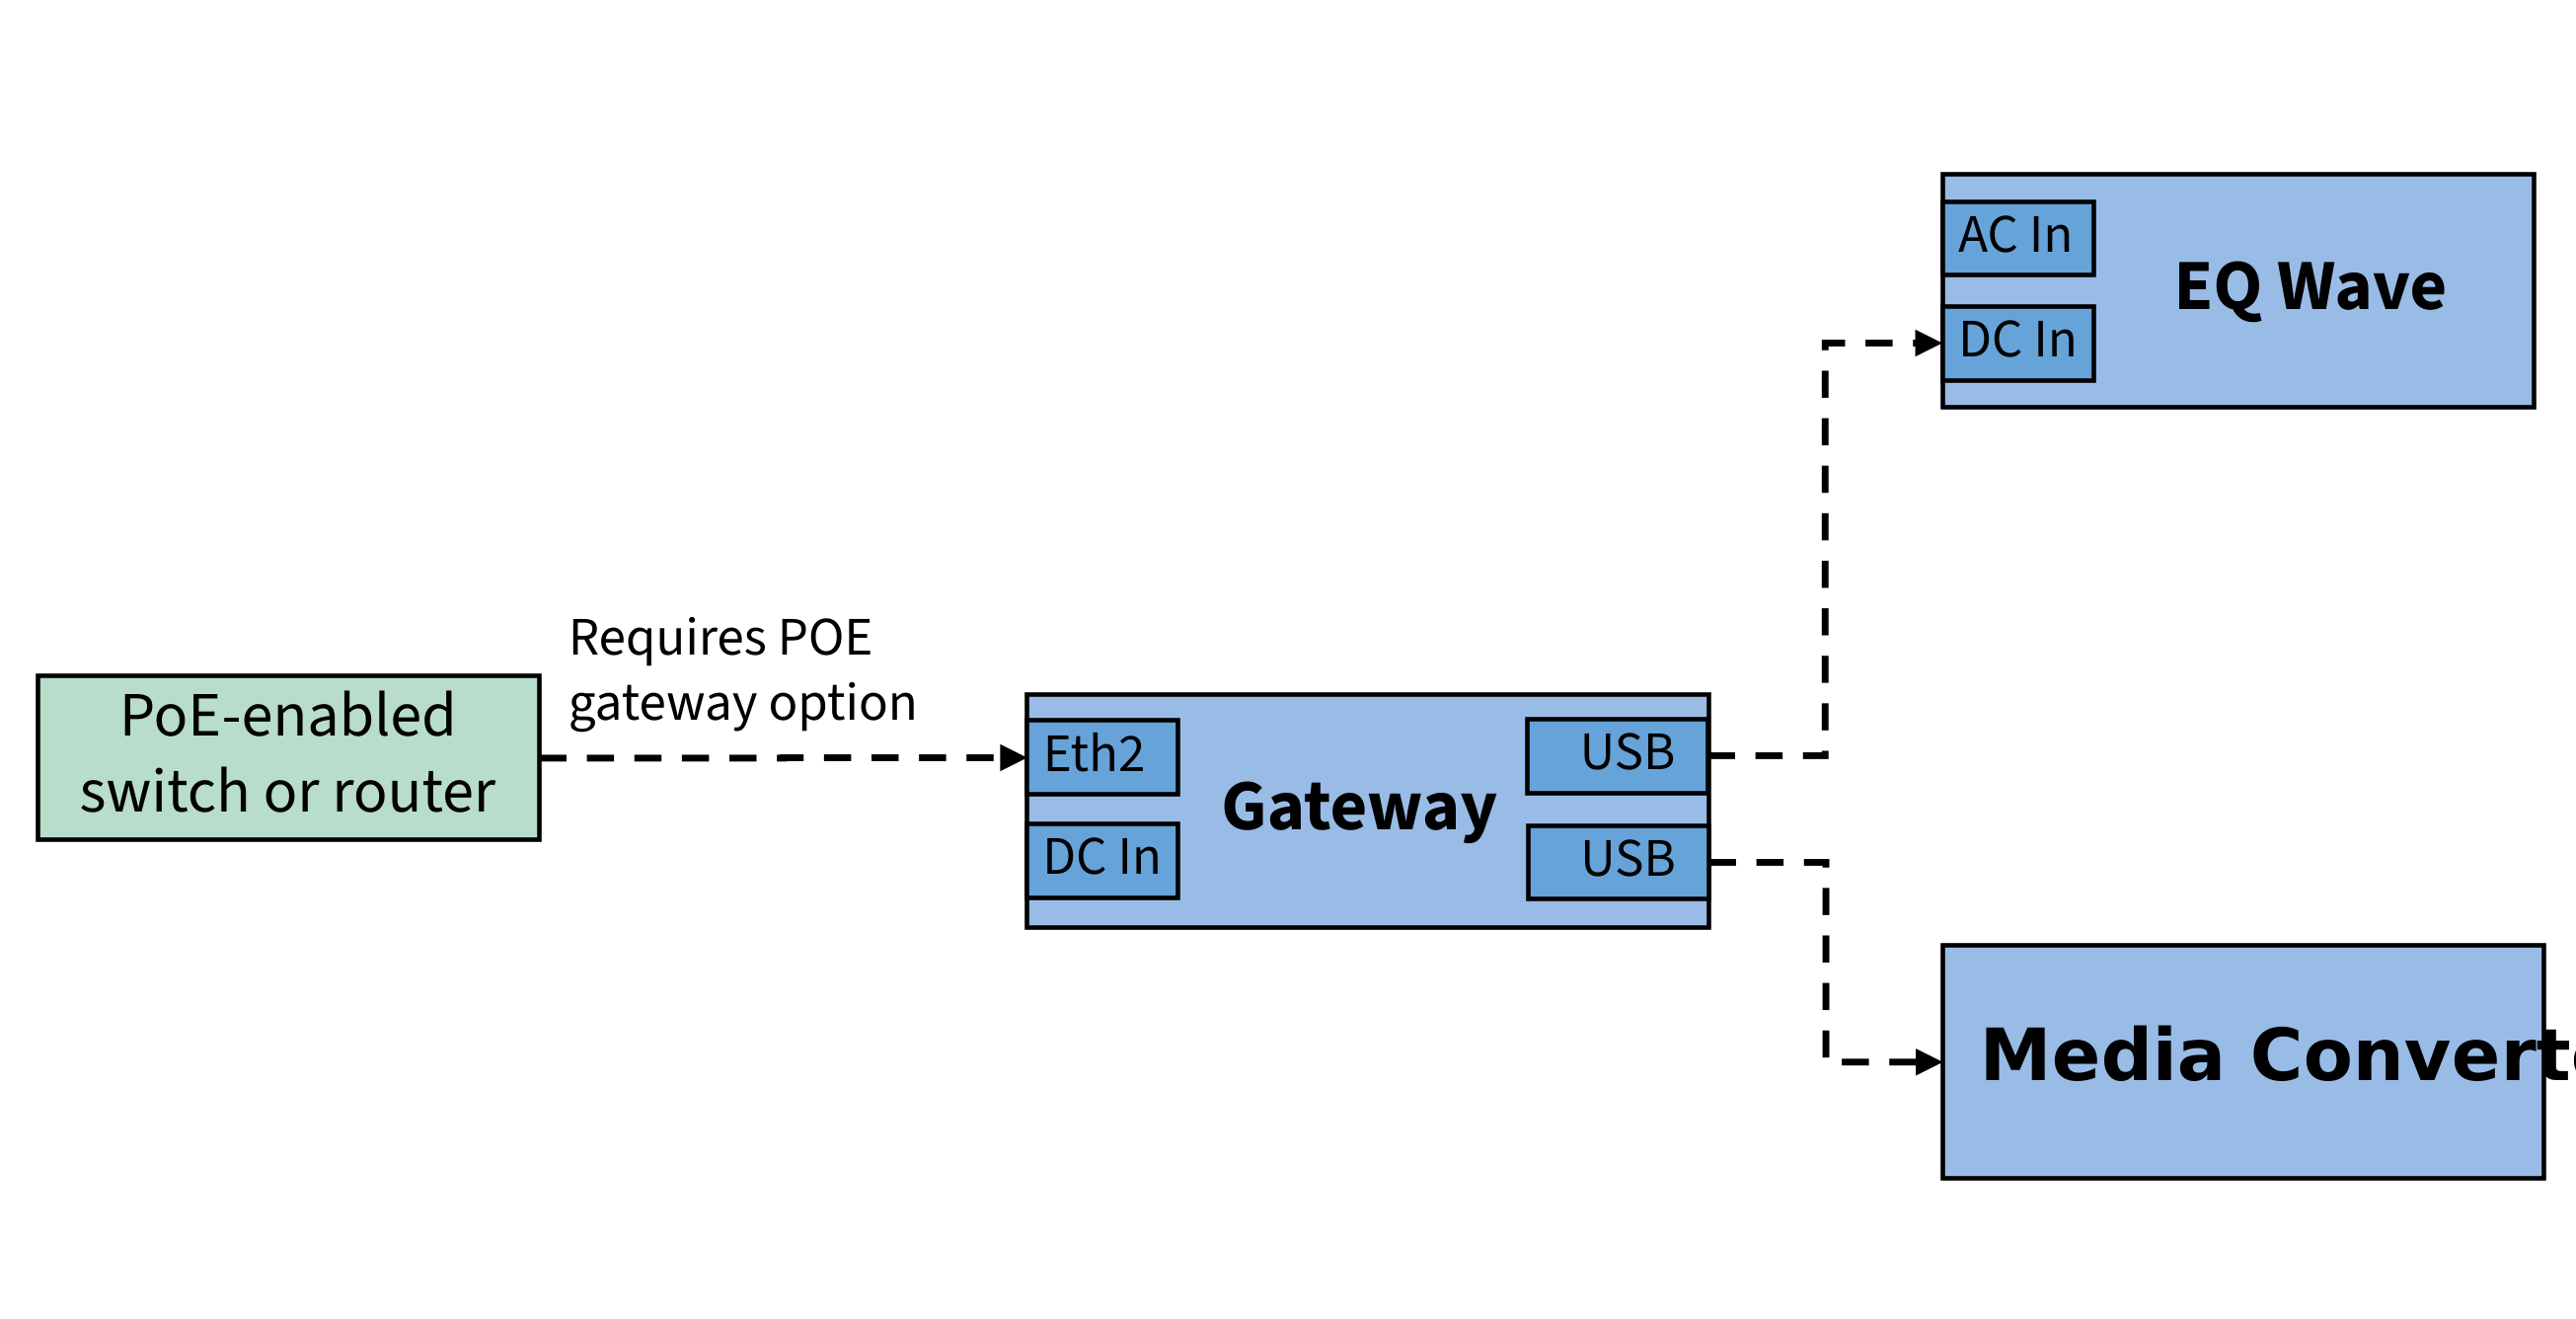
Recommended: PoE gateway + USB-powered media converter
Ethernet Ports
The Compulab gateway has two Ethernet ports with two different roles:
- Sensor port — Connects to the EQ Wave sensor via the media converter. Fixed at 192.168.10.2/24.
- LAN port — Connects to your facility network. Configurable via LAN Configuration. PoE power input, if used, connects here.
warning
IOT-GATE: The case label ETH2 corresponds to OS interface eth0 (the LAN port). If you see eth0 in the OS, that is the LAN port, not the sensor port.
IOT-DIN: Case labels match OS interface names (ETH1 → eth1, ETH0 → eth0).
| IOT-GATE Case Label | IOT-DIN Case Label | OS Interface | Role | |
|---|---|---|---|---|
| Sensor port | ETH1 | ETH1 (top) | eth1 | EQ Wave connection |
| LAN port | ETH2 | ETH0 (bottom) | eth0 | Facility network (PoE on IOT-GATE) |
For other gateway hardware (Raspberry Pi, flex deployments), port assignments differ. See Port Assignments for the complete table.
LED Status Indicators
The gateway uses two bi-color (green/red) LEDs to show service status:
- Power Monitor (pmon) Service:
- Green: Blinks at ~2.5Hz (every 10/12 cycles) during normal operation
- Red: Lights up to indicate error conditions
- Waveform (wave) Service — typically the 2nd LED:
- Green: Blinks at ~2.5Hz during normal operation
- Red: Lights up to indicate error conditions
The gateway’s RJ45 Ethernet ports have amber LEDs for link and green LEDs for activity.
The gateway also has a green LED on the power button, to indicate the device is powered up.
For EQ Wave sensor and media converter LED indicators, see EQ Wave Installation.
Lab Gateway: Raspberry Pi
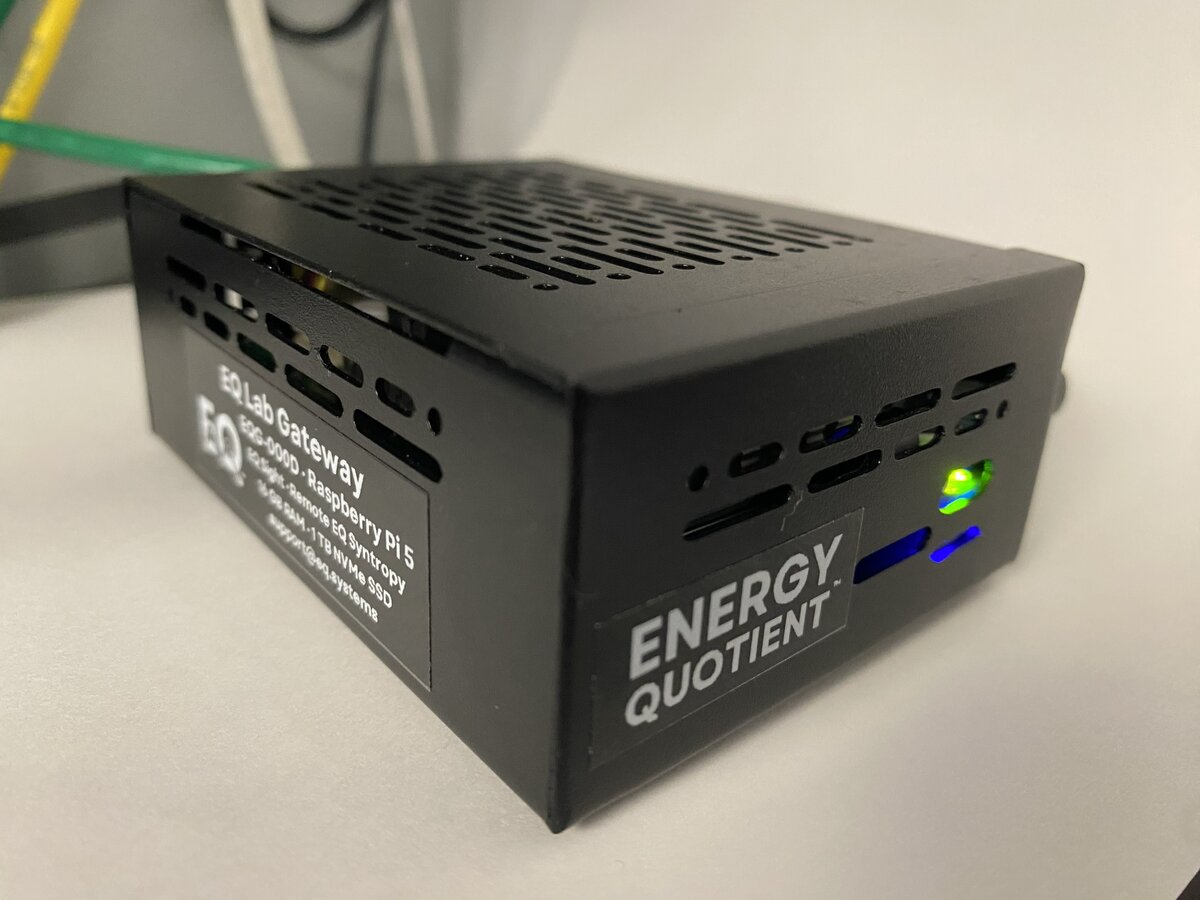
EQ Lab Gateway (Raspberry Pi 5, 16 GB RAM, 1 TB NVMe SSD)
The Lab Gateway is built on Raspberry Pi 5. It runs the same EQ Watch software stack as the industrial gateways but is suited for lab environments, workbench testing, demonstrations, and smaller deployments where industrial hardening is not required.
Technical Specifications
- Platform: Raspberry Pi 5, 16 GB RAM
- Processor: Broadcom BCM2712 quad-core ARM Cortex-A76
- Storage: 1 TB NVMe SSD (boot + data)
- Power: 5V/3A USB-C, 10–15W typical
- Operating Temperature: 0°C to 50°C
- Enclosure: Branded steel case with fan cooling
- Network: Built-in Gigabit Ethernet + USB 3.0 Gigabit Ethernet adapter (included)
Network Configuration
The Lab Gateway ships with dual Ethernet pre-configured:
- eth0 (built-in): Sensor network (EQ Wave via media converter)
- USB Ethernet adapter: LAN / facility network
This is the opposite of Compulab gateways where eth1 is typically the sensor interface.
Display & Kiosk Mode
Lab Gateways with a connected monitor can operate in two display modes:
- Kiosk mode (demo user): Chromium opens fullscreen showing EQ Sight. No desktop, no taskbar. Ideal for wall-mounted displays and demonstration units.
- Desktop mode (eqadmin or admin user): Standard desktop environment with full access to terminal, file manager, and browser.
User accounts
| User | Purpose | Desktop | Sudo |
|---|---|---|---|
eqadmin | Vendor/technical access | Full desktop | Yes |
admin | Customer administrator | Full desktop | Yes |
demo | Kiosk display | Chromium fullscreen only | No |
The gateway auto-logs in to whichever user is configured in setup.yml under users.autologin (default: eqadmin).
Switching between modes
Using raspi-config
To change which user auto-logs in:
sudo raspi-config
Navigate to System Options > Boot / Auto Login and select:
- Desktop Autologin — logs in as the current user (shown in the menu)
- Desktop — requires manual login at the greeter (pick any user)
After changing, reboot for it to take effect:
sudo reboot
Using setup.yml (during provisioning)
Set the users.autologin field before running sudo eq system provision:
users:
  autologin: "demo"     # Kiosk mode (Chromium fullscreen)
  # autologin: "eqadmin"  # Desktop mode (default)
Exiting kiosk mode
If the gateway is in kiosk mode and you need temporary access to the desktop:
| Action | Effect |
|---|---|
| Alt+F4 | Closes Chromium, reveals the desktop |
| Ctrl+Alt+T | Opens a terminal window (may work over Chromium) |
| Ctrl+Alt+F2 | Switches to a text console (login with eqadmin) |
| Ctrl+Alt+F1 | Switches back to the graphical session |
Chromium will relaunch in kiosk mode on the next reboot.
To permanently exit kiosk mode, switch the autologin user to eqadmin using raspi-config as described above, then reboot.
Kiosk configuration in setup.yml
Kiosk mode is configured during provisioning via the kiosk section:
kiosk:
  enabled: false                     # Set true for display deployments
  hostname: "{site}.pq.app"         # Site hostname for EQ Sight
  hide_cursor: true                  # Hide mouse cursor when idle
  disable_blanking: true             # Prevent screen from blanking
When enabled, provisioning will:
- Install Chromium and unclutter (cursor hider)
- Add a localhost entry in
/etc/hostsso the hostname resolves locally, bypassing Cloudflare Access - Create autostart entries in the demo user’s home directory
- Disable screen blanking and low-voltage warnings for a clean display
Lab Kit
The Lab Gateway is available as a complete lab kit including an EQ Wave sensor, media converter, POF cable, and all accessories needed for benchtop or panel deployment. Contact support@eq.systems for details.
Data Storage
Every EQ deployment needs local storage for waveform and metrics data. Optional remote storage provides long-term retention and cross-site access. EQ Watch is storage-agnostic; choose the media and architecture that fits your facility.
Local Storage
Local storage is required for all deployments. It buffers incoming data and provides near-term access through EQ Sight. Larger media extends local retention and reduces write wear.
| Media | Interface | Available On | Typical Capacity |
|---|---|---|---|
| microSD card | USB adapter | Compulab IOT-GATE / IOT-DIN | Up to 1.5 TB |
| microSD card | Direct slot | Toradex-based gateways (planned) | Up to 1.5 TB |
| USB SSD | USB 3.0 | Any gateway with USB 3.0 port | Up to 4 TB |
| NVMe SSD | M.2 / PCIe | AGX Orin, Thor | Up to 4 TB |
CPOW data generates approximately 50 GB per day for a typical 3-phase deployment (losslessly compressed; lighter configurations use less). Industrial gateways ship with 1.5 TB storage, providing approximately one month of retention. Lab gateways ship with 1 TB, providing approximately three weeks.
See Storage Media for capacity planning, recommended hardware, formatting, and swap procedures.
Remote Storage
Remote storage replicates data from EQ Watch to a remote server for long-term retention, backup, and cross-site access (typical sync latency ~1 min). It is optional for all deployments except EQ-hosted AI, which requires it. Contact us for details on remote storage options.
| Option | Where | Best For |
|---|---|---|
| EQ-hosted | Dedicated EQ server | Long-term archival, cross-site analytics, EQ-hosted AI |
| Customer-hosted | Customer NAS or data center | Data residency requirements, integration with existing IT infrastructure |
When remote storage is enabled, EQ Watch retains local data for near-term access while the server handles archival. Both copies are accessible through EQ Sight.
Storage Media
EQ Watch records approximately 50 GB of CPOW data per day for a typical 3-phase deployment (losslessly compressed; lighter configurations use less). Each gateway ships with 1 TB (lab) or 1.5 TB (industrial) of storage, providing approximately three weeks to one month of continuous waveform history. This guide explains storage requirements and considerations.
Choice of Storage Hardware
Basic Requirements
- USB storage drive, SD card, or other removable media
- USB port on gateway (USB 3.0 required for optimal performance)
- Minimum write speed of 10 MB/s for CPOW recording
Recommended Features
- Industrial temperature rating (-25°C to 85°C) for harsh environments
- Published endurance ratings (terabytes written, TBW)
- UHS-I or better for optimal performance
Performance Considerations
- Interface speed affects data retrieval and visualization:
- Use the blue USB 3.0 port on front panel for best performance
- Back panel USB 2.0 ports will limit transfer speeds
- Sustained write speed affects recording reliability:
- Minimum required: 10 MB/s (e.g., V10 speed class for SD cards)
- Recommended: 30 MB/s or better (e.g., UHS-I for SD cards)
- Although CPOW data averages less than 1 MB/s, data is written in batches and derived data may be added during postprocessing
Storage Rotation
EQ Watch automatically manages disk space by removing the oldest CPOW data files when free space drops below 4 GB (configurable). If remote storage is enabled, already-replicated files are removed first. Unsynced files are only removed when necessary.
With ~50 GB per day for a typical 3-phase deployment, 1.5 TB of storage provides approximately one month of local retention before rotation begins. Lighter configurations (fewer active channels) use less storage and retain data longer. If your deployment does not include remote data storage, back up any important data before it is overwritten or in case of media failure.
Storage Endurance
- Cards/drives with published endurance ratings (TBW) are strongly recommended for continuous recording
- TBW is the product of rated writes per cell and capacity
- However, actual endurance varies significantly between manufacturers and models
- With a modest 3000 write cycles per cell, endurance varies by capacity:
- A 64 GB card would last about 10.5 years (64 GB × 3000 ÷ 50 GB/day)
- A 1 TB card would last about 164 years (1000 GB × 3000 ÷ 50 GB/day)
Included Hardware
Industrial gateways ship with 1.5 TB microSD storage; lab gateways include 1 TB NVMe. For replacements or self-sourced media:
- SanDisk MobileMate USB 3.0 Card Reader (SanDisk part number SDDR-B531-AN6NN)
- SanDisk 1.5 TB Ultra UHS-I microSDXC Memory Card (or 1 TB for lab gateways):
- Operating temperature -25°C to 85°C
- V10 speed class (10 MB/s minimum)
- UHS-I interface
- 150 MB/s sequential read
- 10-year manufacturer warranty
- Write endurance not rated
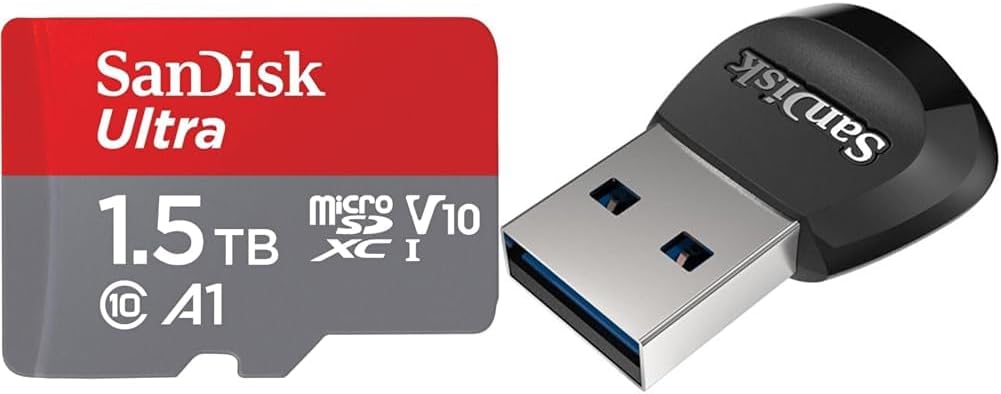
SanDisk Ultra UHS-I microSDXC Memory Card and MobileMate USB 3.0 Card Reader
Swapping Storage Media
note
These instructions cover both SD cards and other USB storage devices like flash drives or external hard drives. For best performance, always use the blue USB 3.0 port on the front panel of the gateway.
Prerequisites
- New storage media (pre-formatted from Energy Quotient, or bring your own)
- SSH access to gateway if you are using your own storage media
Steps
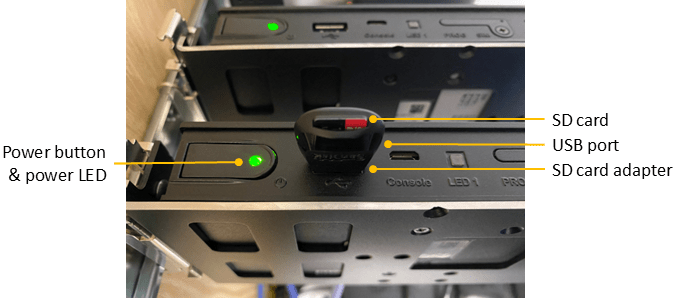
Picture of gateway including power button, power LED, and SD card with adapter
-
To safely shut down the gateway:
- Press and hold the power button for 1 second, then release
- Wait for the LED to turn off (about 2–3 seconds) before proceeding
-
Remove the storage media:
- For SD cards: Remove card from adapter (may be easier to remove adapter from USB first)
- For USB devices: Simply unplug from the USB port
-
Insert the new storage media:
- For SD cards: Insert new card into adapter and reinsert into USB port
- For USB devices: Plug directly into USB port
-
Press and hold the power button for 1 second to turn the gateway back on.
-
If you are using your own storage media, follow the Storage Media Setup instructions to format and prepare the media.
Storage Media Setup
These instructions are for users who purchase their own storage media rather than using pre-formatted media from Energy Quotient. This process will prepare the media for use with EQ Watch.
warning
The following commands will erase all data on the SD card. Make sure you have selected the correct device!
- Check Device
# Insert SD card into adapter and adapter into gateway's USB port ls /dev/sda* # Confirm that /dev/sda1 exists # If not, try: # sudo mknod /dev/sda1 b 8 1 # Useful commands for device verification: lsblk -o name,uuid,label sudo blkid - Partition and Format
# Create a new partition table and single partition using all space sudo parted -s /dev/sda mklabel gpt sudo parted -s /dev/sda mkpart primary ext4 0% 100% # Format the card with no percentage-based reserved space sudo mkfs.ext4 /dev/sda1 -L eqdata -m 0 # Reserve 100MB (25600 4K blocks) for log management sudo tune2fs -r 25600 /dev/sda1 # Mount and set up permissions sudo mount -a sudo rm -r /mnt/eqdata/lost+found/ # Set correct ownership and permissions for synapse group sudo chown synapse:synapse /mnt/eqdata sudo chmod 2775 /mnt/eqdata - Verify
# Check mount points, sizes, and device info df sudo blkid # Check filesystem integrity (unmount first) sudo umount /dev/sda1 sudo e2fsck -f /dev/sda1 sudo mount /dev/sda1 /mnt/eqdata - Remove or start using the new media
# To remove the media:
sudo umount /dev/sda1

# Or to restart and use the new media:
sudo shutdown -r now
AI Compute
EQ Syntropy is optional and requires GPU-accelerated hardware. Every gateway runs EQ Watch and EQ Sight without it. When you want Syntropy’s physics-informed analytics, event detection, and AI-assisted diagnostics, choose where to run it:
| Option | Hardware | Data Location | Best For |
|---|---|---|---|
| Edge AI | NVIDIA AGX Orin or Thor on-site | Local (NVMe SSD) | Air-gapped sites, data sovereignty, lowest latency |
| EQ-Hosted | Dedicated EQ server | Replicated to EQ server | No GPU needed on-site; cross-site analytics |
| Customer-Hosted | Customer data center GPU (RTX 4090 class or better) | Customer servers | Enterprise IT with existing GPU infrastructure |
All three options deliver the same Syntropy capabilities through EQ Sight. The choice depends on your network environment, data policies, and existing infrastructure.
With edge AI or customer-hosted deployments, AI inference runs entirely on local hardware. There are no per-query fees, no usage limits, and no dependency on external services. Engineers can run as many diagnostic queries, investigate as many anomalies, and explore as much historical data as they need. The cost of the next analysis is the electricity to run it.
EQ-hosted deployments provide the same Syntropy capabilities with EQ managing the AI infrastructure on your behalf.
AI Gateway: NVIDIA AGX Orin
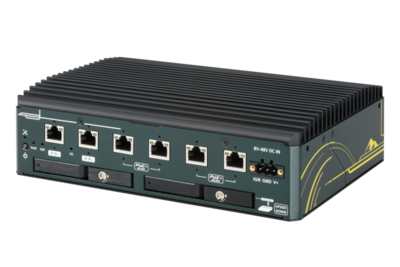
The Neousys NRU-220S with NVIDIA Jetson AGX Orin provides edge AI capabilities for EQ deployments requiring on-premises intelligence. The fanless industrial system combines gateway functionality with GPU-accelerated processing.
When to Choose AGX Orin
- On-premises AI: GPU-accelerated analytics without cloud dependency
- Multi-sensor gateway: Up to 5 EQ Wave sensors per unit via direct Ethernet connection (6 ports; 1 reserved for facility LAN). Multi-sensor configurations available upon request.
- Air-gapped environments: Defense, critical infrastructure, or facilities with strict network isolation
For deployments without AI requirements, the EQ Gateway provides a simpler, lower-cost solution.
Platform Specifications (Neousys NRU-220S)
| Component | Specification |
|---|---|
| Module | NVIDIA Jetson AGX Orin 64GB |
| AI Performance | 275 TOPS (INT8) |
| GPU | 2048-core NVIDIA Ampere with 64 Tensor Cores |
| CPU | 12-core Arm Cortex-A78AE @ 2.2 GHz |
| Memory | 64GB LPDDR5 (unified CPU/GPU) |
| Storage | NVMe SSD (1-4TB recommended) |
| Ethernet | 2x 2.5GbE (Intel I225) + 4x GbE with PoE+ (802.3at, 25.5W per port, 100W total) |
| Power | 15-60W (configurable power profiles) |
| Operating Temp | -25°C to 50°C |
| Form Factor | Fanless industrial system |
Network Configuration
The NRU-220S has six Ethernet ports with screw-lock connectors:
| Ports | Type | Use |
|---|---|---|
| Port 1 (2.5GbE) | Facility LAN | DHCP or static IP for EQ Sight access |
| Port 2 (2.5GbE) | Available | Second LAN or additional sensor |
| Ports 3-6 (GbE PoE+) | Sensor network | One port per EQ Wave media converter |
For installations with more sensors than available ports, use a managed switch on the sensor subnet.
See LAN Configuration for detailed network setup.
AI Capabilities
When EQ Syntropy is enabled on the AGX Orin, the GPU provides hardware acceleration for physics-informed analytics, event detection, and diagnostic models. AI inference runs locally with no per-query costs, no usage limits, and no external connectivity required. AI capabilities are accessed through EQ Sight.
See EQ Syntropy for details on AI features.
Software Stack
| Layer | Component | Purpose |
|---|---|---|
| OS | JetPack 6.x (Ubuntu-based) | NVIDIA-optimized Linux distribution |
| Runtime | CUDA 12.x, TensorRT | GPU acceleration framework |
| Watch | EQ Watch | Data collection, storage, REST API |
| AI | EQ Syntropy | Physics-informed analytics |
| Interface | EQ Sight | Web-based visualization |
Storage Requirements
CPOW data storage scales with sensor count and retention period:
| Sensors | Daily Storage | 1-Month Retention | 90-Day Retention |
|---|---|---|---|
| 1 | ~50 GB | 1.5 TB | 4.5 TB |
| 3 | ~150 GB | 4.5 TB | 13.5 TB |
| 5 | ~250 GB | 7.5 TB | 22.5 TB |
Storage varies with channel count and signal complexity. The figures above assume a typical 3-phase deployment (~50 GB/day per sensor). Lighter configurations (fewer active channels) use less.
NVMe SSD recommended for primary storage. See Storage Media for capacity planning.
Installation
EQ provides pre-configured AGX Orin systems with all software installed. On-site installation involves:
- Mount the NRU-220S and connect power
- Connect facility LAN to Port 1
- Connect EQ Wave sensors via media converters to the GbE PoE+ ports
- Access EQ Sight via web browser
Contact support@eq.systems for deployment assistance.
AI Gateway: NVIDIA Thor
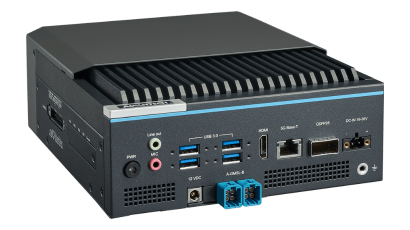
The Advantech MIC-742-AT with NVIDIA Jetson Thor provides edge AI compute for large-scale EQ deployments. The 100GbE QSFP28 interface supports high-density sensor networks via managed switching, making it suitable for campus-scale monitoring.
When to Choose Thor
- Large-scale monitoring: High sensor density across a facility or campus
- Maximum AI throughput: 2,070 FP4 TFLOPs for demanding inference workloads
- High-bandwidth aggregation: QSFP28 with 4x 25GbE breakout for sensor network fabric
- Industrial environments: Extended operating temperature range (-10°C to 60°C)
For single-facility deployments with fewer than 5 sensors, the AGX Orin provides excellent AI capabilities at lower cost. For deployments without AI requirements, the EQ Gateway is the simplest option.
Platform Specifications
| Component | MIC-742-AT (Production) | MIC-743-AT (Development) |
|---|---|---|
| Module | NVIDIA Jetson Thor T5000 | NVIDIA Jetson Thor T5000 |
| AI Performance | 2,070 FP4 TFLOPs | 2,070 FP4 TFLOPs |
| GPU | 2560 CUDA cores, 96 Tensor cores | 2560 CUDA cores, 96 Tensor cores |
| Memory | 128 GB LPDDR5X (unified) | 128 GB LPDDR5X (unified) |
| Ethernet | 1x 5GbE RJ45 + 1x QSFP28 (4x 25GbE) | 1x 5GbE RJ45 + 1x QSFP28 (4x 25GbE) |
| Additional I/O | 4x USB 3.2, HDMI, 4x CAN FD, 8-ch GMSL2.0, I2C, 2x SATA | 4x USB 3.2, HDMI, M.2 Wi-Fi, M.2 LTE/5G |
| Operating Temp | -10°C to 60°C | -10°C to 35°C |
| Target Use | Production deployments | Development and benchmarking |
Network Configuration
| Interface | Type | Use |
|---|---|---|
| RJ45 (5GbE) | Facility LAN | Uplink for EQ Sight access and remote management |
| QSFP28 (4x 25GbE) | Sensor network | Breakout to managed switches for EQ Wave sensors |
The QSFP28 port supports 4x 25GbE lanes via standard breakout cables. Each lane connects to a managed switch serving multiple EQ Wave sensors via media converters.
Platform Comparison
| Aspect | Thor (MIC-742-AT) | AGX Orin (NRU-220S) | Standard Gateway |
|---|---|---|---|
| AI Performance | 2,070 FP4 TFLOPs | 275 INT8 TOPS | None (CPU only) |
| Memory | 128 GB LPDDR5X | 64 GB LPDDR5 | 4 GB |
| Sensor Network | QSFP28 breakout to switches | 5 direct GbE ports | 1 dedicated port |
| Operating Temp | -10°C to 60°C | -25°C to 50°C | -40°C to +80°C |
| Form Factor | Industrial edge server | Fanless industrial | DIN-rail gateway |
Current Status
EQ is actively developing the Thor deployment option. Hardware (MIC-743-AT) is in hand for integration and validation.
Thor deployment is under active development. Contact support@eq.systems for roadmap updates and early access.
EQ-Hosted AI
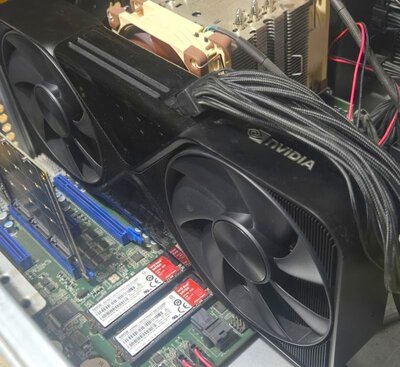
EQ-hosted AI runs EQ Syntropy on a dedicated EQ server. Your gateway syncs waveform and metrics data to the server, where Syntropy models run and return results to EQ Sight.
How It Works
- Gateway collects data from EQ Wave sensors and stores it locally
- Data syncs to the EQ server over your network connection
- Syntropy runs physics-informed analytics on the server
- Results are available through EQ Sight on the gateway and remotely via your
[site].pq.appsubdomain
Requirements
- Network connectivity from the gateway to the EQ server
- Remote data storage enabled on the gateway (the AI models run on the same server that stores the data)
Advantages
- No GPU hardware needed at your facility
- No AI software to install or maintain on-site
- Cross-site analytics available when multiple facilities sync to the same server
- Same Syntropy capabilities as edge AI deployments
- AI infrastructure managed by EQ; no per-query fees or usage limits
When to Choose EQ-Hosted
- Your facility has reliable network connectivity
- You prefer EQ to manage the AI infrastructure
- You want cross-site visibility across multiple deployments
- You do not have strict data residency requirements
For facilities that require all data to stay on-premises, see Edge AI or Self-Hosted options.
Customer-Hosted AI
For organizations with existing data center infrastructure, EQ Syntropy can be deployed on customer servers with full AI capabilities.
Overview
Customer-hosted deployment is designed for:
- Enterprise environments with established IT infrastructure
- Organizations with strict data residency requirements
- Air-gapped or restricted network environments
- Multi-site deployments requiring centralized management
AI inference runs locally with no per-query fees, no usage limits, and no external dependencies. Once deployed, the marginal cost of additional analysis is the compute to run it.
Requirements
Minimum Server Specifications
- CPU: 8+ cores, x86-64 architecture
- RAM: 32GB minimum, 64GB recommended
- Storage: 1TB NVMe SSD for application and recent data
- Network: Gigabit Ethernet connectivity to gateway devices
Recommended GPU (for full AI capabilities)
- NVIDIA GPU: RTX 4090 or A6000 class
- VRAM: 24GB minimum
- Driver: CUDA 12.x compatible
Operating System
- Debian 12 (Bookworm) or Ubuntu 22.04 LTS
- Docker and Docker Compose for containerized deployment
- Systemd for service management
Architecture
Customer-hosted deployments typically include:
- Application Server: EQ Syntropy core services (Rust backend, Python tools)
- Data Storage: Structured parquet files for waveform data, DuckDB for indexed queries
- GPU Server: Optional, for AI inference workloads
Installation
Customer-hosted deployments use the same gateway software package as flex gateway deployments, installed on customer infrastructure.
Contact support@eq.systems for installation guidance and enterprise deployment assistance.
LAN Configuration
The gateway’s LAN port can be configured to match your network requirements. By default, it is set to obtain an IP address automatically via DHCP.
Port Assignments
The gateway has two Ethernet roles:
- Sensor port — Connects to the EQ Wave sensor via the media converter. Fixed at 192.168.10.2/24. Not user-configurable.
- LAN port — Connects to your facility network. Configurable (DHCP by default).
Which physical port or network interface fills each role depends on the gateway hardware:
| Gateway | Sensor Port | LAN Port | Notes |
|---|---|---|---|
| Compulab IOT-GATE-iMX8PLUS | eth1 (case label: ETH1) | eth0 (case label: ETH2) | Case label ETH2 does not match OS name eth0. PoE input on this port. |
| Compulab IOT-DIN-iMX8PLUS | eth1 (case label: ETH1, top) | eth0 (case label: ETH0, bottom) | Case labels match OS interface names. |
| Raspberry Pi 5 | eth0 (built-in) | USB Ethernet adapter or Wi-Fi | Built-in NIC is used for the sensor because it has lower latency than USB. |
| Flex (customer hardware) | Lowest-latency NIC | Secondary NIC or Wi-Fi | Assign the NIC closest to the CPU (e.g., PCIe-attached, not USB) as the sensor port. |
The gateway software creates two NetworkManager connection profiles that abstract away these differences: eq-sensor (sensor port) and eq-lan (LAN port). The nmcli commands in this guide use these profile names and work on all platforms.
Prerequisites
- SSH access to the gateway
- Choice and details of the network configuration:
-
DHCP configuration:
- Network CIDR from your administrator (e.g., 192.168.1.0/24)
-
Static IP configuration:
- Network details from your administrator:
- IP address and subnet mask (e.g., 192.168.1.100/24)
- Gateway address
- DNS server addresses (optional)
- Network details from your administrator:
-
Direct PC connection:
- Choose a static IP/subnet (
<static-ip>/<subnet>) for the gateway. Any valid IP/subnet will work, but we recommend 192.168.1.2/24 because:- It’s a commonly used private network range
- It allows direct connection while keeping the sensor connected
- Choose a static IP/subnet (
-
warning
If you plan to connect the gateway to a LAN, configure the IP settings according to your network requirements instead of using the direct PC connection settings.
Steps
1. View Current Configuration
# List all network connections
nmcli connection show

# Show details for LAN connection
nmcli connection show "eq-lan"

# Show active connections (green indicates active)
nmcli -p connection show
2. Implement the Chosen IP Configuration
Choose one of the following configuration methods:
Option A: DHCP Configuration (Default)
To use automatic IP address configuration:
sudo nmcli connection modify "eq-lan" ipv4.method auto
Option B: Static IP Configuration
You might want to configure a static IP address in these scenarios:
- Network policy requires static IP addresses
- Direct connection to a PC/laptop (when not connecting to a LAN)
For LAN integration with static IP requirements:
sudo nmcli connection modify "eq-lan" \
    ipv4.method manual \
    ipv4.addresses "<ip-address>/<subnet-mask>" \
    ipv4.gateway "<gateway-address>" \
    ipv4.dns "<dns-servers>"
Example using typical values (coordinate with your network administrator):
sudo nmcli connection modify "eq-lan" \
    ipv4.method manual \
    ipv4.addresses "192.168.1.100/24" \
    ipv4.gateway "192.168.1.1" \
    ipv4.dns "8.8.8.8,8.8.4.4"
For direct PC connection:
sudo nmcli connection modify "eq-lan" \
    ipv4.method manual \
    ipv4.addresses "<static-ip>/<subnet>"  # Use your chosen static IP and subnet from prerequisites
3. Activate the New Configuration
sudo nmcli connection down "eq-lan"
sudo nmcli connection up "eq-lan"
4. Verify Configuration
After applying the configuration:
-
For LAN connection:
- Connect the gateway’s LAN port to your network
- Check the gateway’s IP address:
nmcli connection show "eq-lan" | grep IP4.ADDRESS
-
For direct PC connection:
- Set your PC’s network adapter to a static IP in the same subnet as your chosen static IP (but different from the gateway’s IP)
- For example, with gateway IP 192.168.1.2/24:
- Configure your PC as 192.168.1.3/24
- Connect an Ethernet cable between your PC and the gateway’s LAN port
- Your gateway’s IP address will be your chosen static IP
important
Make note of the gateway’s IP address for future access.
5. Allow SSH Access
The gateway’s firewall only allows SSH from the sensor subnet (192.168.10.0/24) and the VPN (100.64.0.0/16) by default. To access the gateway via your LAN, add a firewall rule for your subnet:
# Replace <network-cidr> with your subnet
# For example: 192.168.2.0/24 or 10.0.1.0/24
sudo ufw allow from <network-cidr> to any port ssh
6. Verify SSH Access
Test the new configuration by connecting to the gateway following SSH Access
Troubleshooting
If you lose network connectivity or cannot connect:
- Check network cable connections
- Verify IP address configuration with
nmcli connection show "eq-lan" - Review firewall rules with
sudo ufw status - Test network connectivity
You can always access the gateway through the sensor port if needed.
LAN Configuration
The gateway’s LAN port can be configured to match your network requirements. By default, it is set to obtain an IP address automatically via DHCP.
Port Assignments
The gateway has two Ethernet roles:
- Sensor port — Connects to the EQ Wave sensor via the media converter. Fixed at 192.168.10.2/24. Not user-configurable.
- LAN port — Connects to your facility network. Configurable (DHCP by default).
Which physical port or network interface fills each role depends on the gateway hardware:
| Gateway | Sensor Port | LAN Port | Notes |
|---|---|---|---|
| Compulab IOT-GATE-iMX8PLUS | eth1 (case label: ETH1) | eth0 (case label: ETH2) | Case label ETH2 does not match OS name eth0. PoE input on this port. |
| Compulab IOT-DIN-iMX8PLUS | eth1 (case label: ETH1, top) | eth0 (case label: ETH0, bottom) | Case labels match OS interface names. |
| Raspberry Pi 5 | eth0 (built-in) | USB Ethernet adapter or Wi-Fi | Built-in NIC is used for the sensor because it has lower latency than USB. |
| Flex (customer hardware) | Lowest-latency NIC | Secondary NIC or Wi-Fi | Assign the NIC closest to the CPU (e.g., PCIe-attached, not USB) as the sensor port. |
The gateway software creates two NetworkManager connection profiles that abstract away these differences: eq-sensor (sensor port) and eq-lan (LAN port). The nmcli commands in this guide use these profile names and work on all platforms.
Prerequisites
- SSH access to the gateway
- Choice and details of the network configuration:
-
DHCP configuration:
- Network CIDR from your administrator (e.g., 192.168.1.0/24)
-
Static IP configuration:
- Network details from your administrator:
- IP address and subnet mask (e.g., 192.168.1.100/24)
- Gateway address
- DNS server addresses (optional)
- Network details from your administrator:
-
Direct PC connection:
- Choose a static IP/subnet (
<static-ip>/<subnet>) for the gateway. Any valid IP/subnet will work, but we recommend 192.168.1.2/24 because:- It’s a commonly used private network range
- It allows direct connection while keeping the sensor connected
- Choose a static IP/subnet (
-
warning
If you plan to connect the gateway to a LAN, configure the IP settings according to your network requirements instead of using the direct PC connection settings.
Steps
1. View Current Configuration
# List all network connections
nmcli connection show

# Show details for LAN connection
nmcli connection show "eq-lan"

# Show active connections (green indicates active)
nmcli -p connection show
2. Implement the Chosen IP Configuration
Choose one of the following configuration methods:
Option A: DHCP Configuration (Default)
To use automatic IP address configuration:
sudo nmcli connection modify "eq-lan" ipv4.method auto
Option B: Static IP Configuration
You might want to configure a static IP address in these scenarios:
- Network policy requires static IP addresses
- Direct connection to a PC/laptop (when not connecting to a LAN)
For LAN integration with static IP requirements:
sudo nmcli connection modify "eq-lan" \
    ipv4.method manual \
    ipv4.addresses "<ip-address>/<subnet-mask>" \
    ipv4.gateway "<gateway-address>" \
    ipv4.dns "<dns-servers>"
Example using typical values (coordinate with your network administrator):
sudo nmcli connection modify "eq-lan" \
    ipv4.method manual \
    ipv4.addresses "192.168.1.100/24" \
    ipv4.gateway "192.168.1.1" \
    ipv4.dns "8.8.8.8,8.8.4.4"
For direct PC connection:
sudo nmcli connection modify "eq-lan" \
    ipv4.method manual \
    ipv4.addresses "<static-ip>/<subnet>"  # Use your chosen static IP and subnet from prerequisites
3. Activate the New Configuration
sudo nmcli connection down "eq-lan"
sudo nmcli connection up "eq-lan"
4. Verify Configuration
After applying the configuration:
-
For LAN connection:
- Connect the gateway’s LAN port to your network
- Check the gateway’s IP address:
nmcli connection show "eq-lan" | grep IP4.ADDRESS
-
For direct PC connection:
- Set your PC’s network adapter to a static IP in the same subnet as your chosen static IP (but different from the gateway’s IP)
- For example, with gateway IP 192.168.1.2/24:
- Configure your PC as 192.168.1.3/24
- Connect an Ethernet cable between your PC and the gateway’s LAN port
- Your gateway’s IP address will be your chosen static IP
important
Make note of the gateway’s IP address for future access.
5. Allow SSH Access
The gateway’s firewall only allows SSH from the sensor subnet (192.168.10.0/24) and the VPN (100.64.0.0/16) by default. To access the gateway via your LAN, add a firewall rule for your subnet:
# Replace <network-cidr> with your subnet
# For example: 192.168.2.0/24 or 10.0.1.0/24
sudo ufw allow from <network-cidr> to any port ssh
6. Verify SSH Access
Test the new configuration by connecting to the gateway following SSH Access
Troubleshooting
If you lose network connectivity or cannot connect:
- Check network cable connections
- Verify IP address configuration with
nmcli connection show "eq-lan" - Review firewall rules with
sudo ufw status - Test network connectivity
You can always access the gateway through the sensor port if needed.
Wi-Fi Configuration
If your gateway is equipped with a Wi-Fi transceiver, you can follow the steps below to connect to Wi-Fi networks in range. Raspberry Pi gateways have built-in Wi-Fi and do not require external antennas.
Steps
1. Connect Antennas (Compulab only)
Compulab IOT-GATE gateways require external Wi-Fi antennas. Connect the antennas to the WLAN-A/BT and WLAN-B ports. Tighten securely but not aggressively.
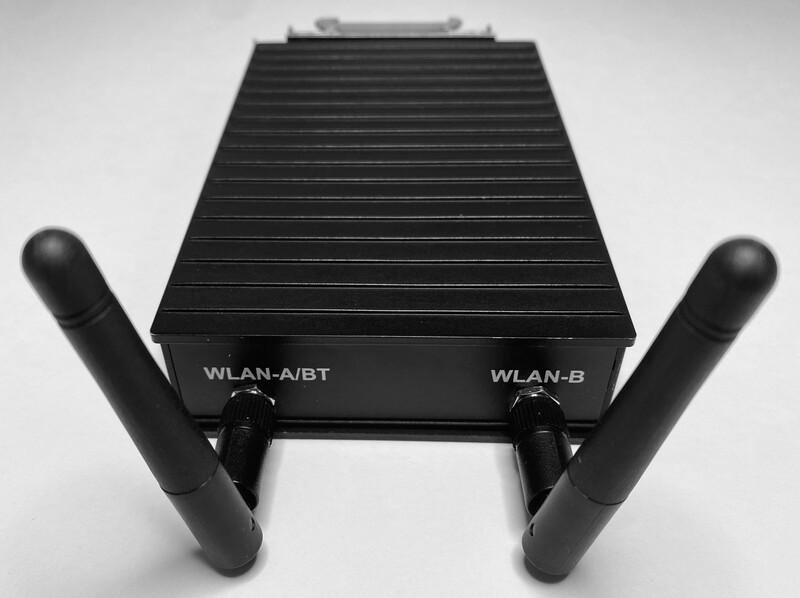
- Keep antennas at least 20cm away from large metal objects
- Maintain clear line of sight to your Wi-Fi router when possible
- Both antennas must be connected for optimal MIMO performance
2. Add Networks
Your gateway can be pre-configured with Wi-Fi network settings during ordering. If you need to modify or add networks later, use the manual configuration steps below.
Manual Configuration
# Enable Wi-Fi radio (if disabled)
sudo nmcli radio wifi on

# List available networks
sudo nmcli device wifi

# Connect to a network
sudo nmcli device wifi connect "<AP name>" password "<password>"
note
Replace <AP name> and <password> with your credentials for your Wi-Fi access point (AP).
Managing Saved Networks
# List saved connections
nmcli connection show

# Delete a saved network
nmcli connection delete "<connection_name>"

# Modify connection priority
nmcli connection modify "<connection_name>" connection.autoconnect-priority <number>
3. Verify Connection
# Check connection status
nmcli connection show
nmcli device status

# Test internet connectivity
ping -c 4 8.8.8.8

# Check signal strength
nmcli device wifi list --rescan yes
4. SSH Access Over Wi-Fi (optional)
To enable SSH access over Wi-Fi:
- Find the Wi-Fi network CIDR:
# Get Wi-Fi IP and subnet information
ip addr show wlan0 | grep "inet "
- Allow SSH access from the Wi-Fi network:
# Replace <network-cidr> with your Wi-Fi network
# For example: sudo ufw allow from 192.168.1.0/24 to any port ssh
sudo ufw allow from <network-cidr> to any port ssh
-
Note your gateway’s current IP address for future access
ip -brief addr show wlan0 -
Test the new configuration by connecting to the gateway following SSH Access
important
This IP address may change when the gateway reconnects unless your Wi-Fi router is configured to assign a fixed IP address. For reliable remote access, consider using a static IP configuration or the gateway’s ethernet connection.
Troubleshooting
Basic Diagnostics
# Show detailed device information
sudo nmcli device show wlan0

# Restart Wi-Fi interface
sudo nmcli radio wifi off
sudo nmcli radio wifi on
Common Issues
Poor Signal Strength
- Verify antenna installation
- Check antenna orientation
- Reduce distance to Wi-Fi router
- Remove metal obstacles
Connection Drops
- Check for interference from other devices
- Verify router settings (band, channel)
- Check system logs:
journalctl -u NetworkManager | tail -n 100
Authentication Failures
- Double-check password
- Verify network security type (WPA2, WPA3)
- Ensure device time is synchronized
- Clear existing connection and retry:
sudo nmcli connection delete "<connection_name>"
sudo nmcli device wifi connect "<AP name>" password "<password>"
Advanced Configuration
Static IP Configuration
nmcli connection modify "<connection_name>" \
    ipv4.method manual \
    ipv4.addresses "192.168.1.200/24" \
    ipv4.gateway "192.168.1.1" \
    ipv4.dns "8.8.8.8,8.8.4.4"
Multiple Network Setup
# Add secondary network (same connection command as above)
sudo nmcli device wifi connect "<AP name>" password "<password>"

# Set connection priorities (higher number = higher priority)
nmcli connection modify "<connection_name 1>" connection.autoconnect-priority 100
nmcli connection modify "<connection_name 2>" connection.autoconnect-priority 50
Additional Resources
SSH Access
The gateway has two Ethernet ports: the sensor port and the LAN port. We recommend starting setup through the sensor port, which always works with a direct Ethernet cable:
- Initial SSH access — Connect directly to the sensor port (fixed at 192.168.10.2).
- Configure LAN — Via SSH, follow LAN Configuration.
- Ongoing access — SSH over the LAN port via your facility network or Wi-Fi.
Alternatively, if the gateway’s LAN port is connected to a DHCP-served network with internet access, and your service includes remote management (as pilot gateways do), our support team can assist remotely via VPN — including sharing the gateway’s LAN IP address and opening the firewall for local SSH access on your behalf. Contact support@eq.systems to arrange this.
If you prefer to set up access yourself, you can also SSH in via the LAN port if you know the DHCP-assigned address (e.g., from your router’s client list) — but you will first need to add your LAN subnet to the firewall via the sensor port (see Allow SSH Access).
note
Which physical port is the “sensor port” depends on your gateway hardware. On Compulab gateways, it is the port labeled ETH1 on the case. See Port Assignments for all platforms.
Firewall
The gateway runs UFW (Uncomplicated Firewall) with a default-deny incoming policy. These ports are open after provisioning:
| Port | Protocol | Service | Allowed From |
|---|---|---|---|
| 22 | TCP | SSH | 192.168.10.0/24 (sensor), 100.64.0.0/16 (VPN) |
| 80 | TCP | EQ Sight | All IPv4 addresses |
SSH is only allowed from the sensor subnet and the VPN. To access the gateway via your LAN, you must add a firewall rule for your subnet during LAN Configuration.
Prerequisites
For all access methods:
- Admin username and password from system documentation
- SSH client:
For sensor port access:
- Ethernet cable
- Ability to configure PC network settings
For LAN port access:
- Network connection
- Gateway’s IP address (otherwise some options for finding it are suggested below)
Initial Access via Sensor Port
The sensor port provides a reliable way to access the gateway with its fixed configuration:
-
Connect your computer directly to the gateway’s sensor port using an Ethernet cable
-
Configure your computer’s Ethernet adapter with a static IP address:
- IP Address: 192.168.10.3 (or any address in 192.168.10.0/24 except 192.168.10.2)
- Subnet Mask: 255.255.255.0
-
Connect using your chosen SSH client with these parameters:
- Host:
192.168.10.2 - Username:
admin - Port: 22
- Connection type: SSH
If using a terminal, the command is:
ssh admin@192.168.10.2 - Host:
After establishing this initial connection, you should:
- Configure the LAN port for your network following LAN Configuration
- If supported and desired, connect to your wireless network following Wi-Fi Configuration
- Test SSH access through the LAN port and/or Wi-Fi
- Disconnect your computer and reconnect the sensor to the sensor port
The LAN port will then become your primary means of accessing the gateway, with Wi-Fi and the sensor port remaining available if needed.
Network Access (LAN/Wi-Fi)
-
Find your gateway’s IP address using one of the following methods
Option A: Use the IP address from your network configuration
- For LAN: See LAN Configuration
- For Wi-Fi: See Wi-Fi Configuration
Option B: Ask your network administrator
Option C: Use your router’s admin interface
- Access your router’s web interface (typically at 192.168.1.1 or similar)
- Look for “Connected Devices” or “DHCP Clients”
- Find the device named
EQG-XXXXwhereXXXXis your gateway’s identifier (capitalized hex)
Option D: Scan your network
- Windows: Use Advanced IP Scanner (download)
- Linux/macOS: Use nmap
# Adjust this to match your network:
sudo nmap -sn 192.168.1.0/24
-
Connect using your chosen SSH client with these parameters:
- Host:
<gateway-ip-address> - Username:
admin - Port: 22
- Connection type: SSH
If using a terminal, the command is:
ssh admin@<gateway-ip-address> - Host:
-
Enter the admin password when prompted
Need Help?
If you are unable to establish a connection, contact support@eq.systems. If the gateway has internet access via the LAN port, we can typically resolve access issues remotely via VPN. Otherwise, we can provide a USB debug cable and instructions for direct console access.